
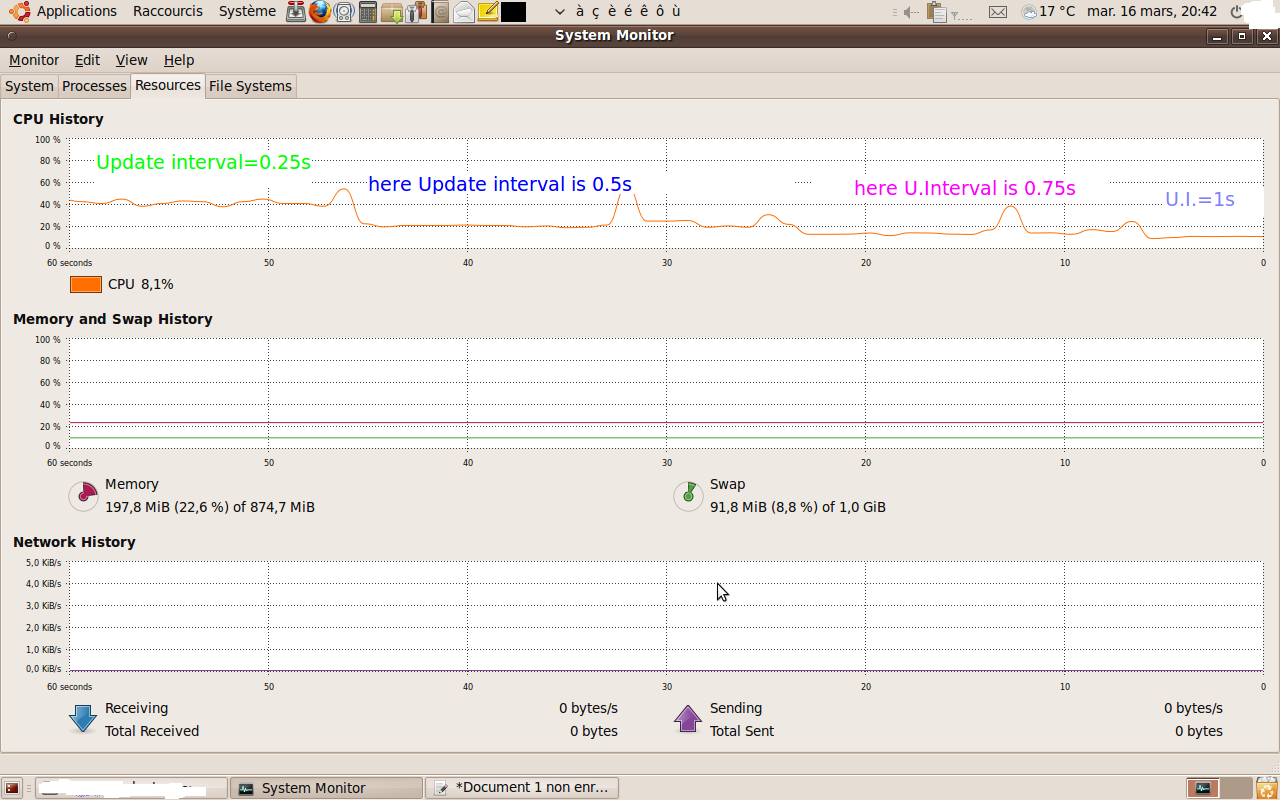
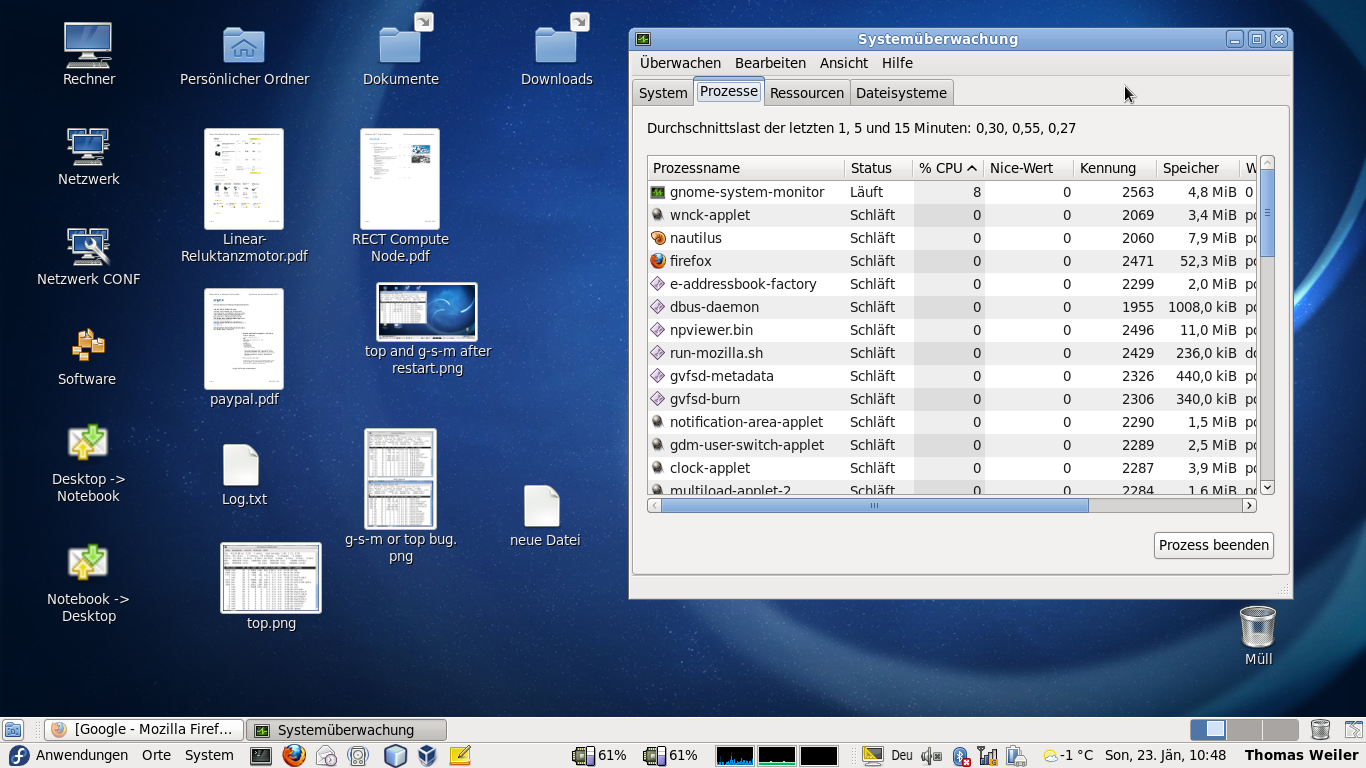
Excessive CPU usage by Gnome System Monitor
| Affects | Status | Importance | Assigned to | Milestone | |
|---|---|---|---|---|---|
| Gnome System Monitor |
Fix Released
|
High
|
|||
| gnome-system-monitor (Debian) |
Invalid
|
Undecided
|
Unassigned | ||
| gnome-system-monitor (Ubuntu) |
Fix Released
|
Low
|
Unassigned | ||
Bug Description
Binary package hint: gnome-system-
Gnome System monitor sometimes claims to be using all of the spare capacity of my CPU, I cannot pinpoint when it happens, but it does happen. I pressed the report bug button while it was using 86% of my CPU according to itself, but now a few minutes later, it has settled on 11%.
System info:
CPU: Intel Celeron 2.6 ghz
RAM: 768 mb
Distro: 7.04 (fully updated)
ProblemType: Bug
Architecture: i386
Date: Mon Mar 19 21:40:54 2007
DistroRelease: Ubuntu 7.04
ExecutablePath: /usr/bin/
Package: gnome-system-
PackageArchitec
ProcCmdline: gnome-system-
ProcCwd: /home/jonathan
ProcEnviron:
LANG=en_DK.UTF-8
PATH=/
SHELL=/bin/bash
SourcePackage: gnome-system-
Uname: Linux jonathan-desktop 2.6.20-8-386 #2 Tue Feb 13 05:15:43 UTC 2007 i686 GNU/Linux

| Changed in gnome-system-monitor: | |
| status: | Unknown → Confirmed |
| Changed in gnome-system-monitor: | |
| status: | New → Confirmed |
| Changed in gnome-system-monitor: | |
| status: | New → Invalid |
| Changed in gnome-system-monitor: | |
| status: | Unknown → Confirmed |
| Changed in gnome-system-monitor: | |
| status: | Confirmed → Triaged |
| Changed in gnome-system-monitor: | |
| importance: | Unknown → High |
| tags: | added: precise |
| Changed in gnome-system-monitor: | |
| status: | Confirmed → Fix Released |
Thank you for your bug. Could you get a backtrace (https:/