
Excessive CPU usage by Gnome System Monitor
| Affects | Status | Importance | Assigned to | Milestone | |
|---|---|---|---|---|---|
| Gnome System Monitor |
Fix Released
|
High
|
|||
| gnome-system-monitor (Debian) |
Invalid
|
Undecided
|
Unassigned | ||
| gnome-system-monitor (Ubuntu) |
Fix Released
|
Low
|
Unassigned | ||
Bug Description
Binary package hint: gnome-system-
Gnome System monitor sometimes claims to be using all of the spare capacity of my CPU, I cannot pinpoint when it happens, but it does happen. I pressed the report bug button while it was using 86% of my CPU according to itself, but now a few minutes later, it has settled on 11%.
System info:
CPU: Intel Celeron 2.6 ghz
RAM: 768 mb
Distro: 7.04 (fully updated)
ProblemType: Bug
Architecture: i386
Date: Mon Mar 19 21:40:54 2007
DistroRelease: Ubuntu 7.04
ExecutablePath: /usr/bin/
Package: gnome-system-
PackageArchitec
ProcCmdline: gnome-system-
ProcCwd: /home/jonathan
ProcEnviron:
LANG=en_DK.UTF-8
PATH=/
SHELL=/bin/bash
SourcePackage: gnome-system-
Uname: Linux jonathan-desktop 2.6.20-8-386 #2 Tue Feb 13 05:15:43 UTC 2007 i686 GNU/Linux

| Jonathan M. (thesims-gx) wrote : | #1 |
- Dependencies.txt Edit (3.6 KiB, text/plain; charset="utf-8")
- ProcMaps.txt Edit (20.7 KiB, text/plain; charset="utf-8")
- ProcStatus.txt Edit (638 bytes, text/plain; charset="utf-8")
| Sebastien Bacher (seb128) wrote : | #2 |
| Changed in gnome-system-monitor: | |
| assignee: | nobody → desktop-bugs |
| importance: | Undecided → Low |
| status: | Unconfirmed → Needs Info |
| Jonathan M. (thesims-gx) wrote : Re: Excessive CPU usage by Gnome System Monitor (backtrace & screenshot | #3 |
- g-s-m terminated by a "kill process" command from me Edit (11.1 KiB, text/plain)
I followed the instructions on the page linked, and have obtained two backtraces, although I am not sure of their usefulness, as the program didn't crash in any of the two periods I had attached the gdb. But anyway, here they are, also included are two screenshots, both showing what I mean, also note the system monitor in the taskbar: nearly all that processor usage is g-s-m.
| Jonathan M. (thesims-gx) wrote : | #4 |
how do I add more than one attachment?
| Jonathan M. (thesims-gx) wrote : | #5 |
- g-s-m terminated by clicking x, but that stopped gdb as well Edit (8.6 KiB, text/plain)
another attachment
| Jonathan M. (thesims-gx) wrote : | #6 |
| Sebastien Bacher (seb128) wrote : | #7 |
Marking unconfirmed, the backtraces are non debug version and not useful, likely an upstream bug and need to be worked by something getting it
| Changed in gnome-system-monitor: | |
| status: | Needs Info → Unconfirmed |
| Sebastien Bacher (seb128) wrote : | #8 |
what update frequency do you use?
| Jonathan M. (thesims-gx) wrote : | #9 |
>what update frequency do you use?
one second in the panel, two in the window. Shouldn't be too much on my 2.6 ghz machine.
| Sebastien Bacher (seb128) wrote : | #10 |
if you use 10 seconds, do you get that bug?
| Jonathan M. (thesims-gx) wrote : | #11 |
>if you use 10 seconds, do you get that bug?
With 10 seconds update on both the taskbar and window, it is mostly stable at <15%, although once in a while, it would report higher numbers, over about five minutes I have seen a few over 80%, and about every half a minute it goes to 30%.
If I remove it from the taskbar, and only have the window open, it seems to have a lower average, but even so, it does once in a while report 60%+.
You might be right in that it is just normal CPU usage...
| Sebastien Bacher (seb128) wrote : | #12 |
It could use some optimization, opening an upstream task, low importance bug though
| mwales (mwales3) wrote : | #13 |
I encountered an issue with gnome-system-
I had a bad behaving task that created about 10,000 zombie tasks. If I clicked on the system monitor applet, when it tried to launch gnome-system-
If it's of any interest, Firefox created the zombies. I think an ill-behaving extension was trying to update itself and created them.
| Andrew Conkling (andrewski) wrote : Re: [Bug 93847] Re: Excessive CPU usage by Gnome System Monitor | #14 |
On 5/11/07, mwales <email address hidden> wrote:
> I encountered an issue with gnome-system-
> usage to goto 100%.
>
> I had a bad behaving task that created about 10,000 zombie tasks. If I
> clicked on the system monitor applet, when it tried to launch gnome-
> system-monitor I never saw the GUI and the CPU spiked to 100%. I killed
> the process that created the zombies, and gnome-system-
> behaving normally for me.
When the CPU is going crazy, that can happen. This bug is about the
System Monitor reporting inaccurate CPU usage for itself in a normal
scenario.
| Markus Kienast (elias1884) wrote : | #15 |
No even though g-s-m does not seem to show exactly the same CPU usage for itself as top is showing, g-s-m seems to have a resource problem after all. It just uses too much CPU for the little task it has to do!
Yes, I agree this should be reported upstream! It is embarrassing if the CPU monitor uses most of the CPU for itself!
| Andrew Conkling (andrewski) wrote : | #16 |
On 5/18/07, elias <email address hidden> wrote:
>
> No even though g-s-m does not seem to show exactly the same CPU usage
> for itself as top is showing, g-s-m seems to have a resource problem
> after all. It just uses too much CPU for the little task it has to do!
>
> Yes, I agree this should be reported upstream! It is embarrassing if the
> CPU monitor uses most of the CPU for itself!
I'm not sure it is using that much. top is generally pretty accurate, and
I'm convinced that g-s-m is just displaying the wrong information for
itself. Especially since the CPU panel applet doesn't reflect this usage
either.
| Id2ndR (id2ndr) wrote : | #17 |
> I'm convinced that g-s-m is just displaying the wrong information for itself
I don't think so : just open top and watch gsm CPU usage.
| Pedro Villavicencio (pedro) wrote : | #18 |
Still an issue with Gutsy?
| Markus Kienast (elias1884) wrote : | #19 |
not as high anymore in gutsy 11-20 on average. still pretty high for a cpu monitor!
| Aryeh Gregor (simetrical+launchpad) wrote : | #20 |
Opening top and gnome-system-
I agree that this isn't a serious problem, but I'd like to pitch in confirmation that it appears to be a real one, not illusory.
| Victor Engmark (victor-engmark) wrote : | #21 |
Using 6-17% on my Core 2 Duo, which is quite extreme. Even Windows' equivalent uses max. 1-3% or so.
| FrankyT (theroarenator) wrote : | #22 |
I'm experiencing similar excessive usage. Intermittently spiking the CPU to 80-100%, (and reducing other high CPU tasks in the process), and running normally at 10-30%. monitoring the system without dramatically affecting the processes monitored is a must for this type of utility.
"You changed the outcome by observing it!" -Hubert Farnsworth
| FrankyT (theroarenator) wrote : | #23 |
It might be worth mentioning that my gutsy box (mentioned in previous post) is a 2.8ghz Celeron w/ 768MB ram, very similar to the configuration of the thread creator.
| Markus Kienast (elias1884) wrote : | #24 |
And this is actually not a misinterpretation of the sys-mon app but
really how much cpu it consumes, unlike what people have suggested
before. I just setup Gutsy on a Celeron 500 and starting g-sys-mon makes
it very unresponsive! g-sys-mon is reporting it's cpu consumption
correctly, but it consumes way to much cpu!
On Sun, 2007-12-09 at 07:39 +0000, FrankyT wrote:
> It might be worth mentioning that my gutsy box (mentioned in previous
> post) is a 2.8ghz Celeron w/ 768MB ram, very similar to the
> configuration of the thread creator.
>
| FrankyT (theroarenator) wrote : | #25 |
I have confirmed that Top reads GSM as using approximately the same CPU% as GMS itself shows. excessive usage does not appear to be a display aberration. top, at 3sec refresh uses at most 0.7% to do basically the same job. I did turn down or off all the settings possible in GSM just in case there is a display feature that causes it to misbehave, but it hasn't changed the results. seems to be a bug with celerons. Mine was a gateway if that helps.
on hardy heron it use 100% of my cpu p4 2.2ghz (2500mo of ram)
system become unresponsive until the program is closed or killed
it seems to happen only when i use the page to show ressources; when i clik on it system become unresponsive instantly
| Andrew Conkling (andrewski) wrote : | #28 |
This bug is about performance in Gutsy and before. Hardy's Resources tab uses some new Cairo rendering for smooth graphs, but yes, the performance problems are known.
------Original Message------
From: cyrildrx
Sender: <email address hidden>
To: Andrew Conkling
ReplyTo: Bug 93847
Sent: Jan 20, 2008 12:06
Subject: [Bug 93847] Re: Excessive CPU usage by Gnome System Monitor
it seems to happen only when i use the page to show ressources; when i
clik on it system become unresponsive instantly
--
Excessive CPU usage by Gnome System Monitor
https:/
You received this bug notification because you are a direct subscriber
of the bug.
| Hladen Spricar (hladenspricar) wrote : | #29 |
Situation here:
High CPU usage only when application is maximized. Graphs then become black.
Hardy Heron 8.04, alpha 4, all updates...
| Andrew Conkling (andrewski) wrote : | #30 |
On Feb 4, 2008 9:27 AM, Sigi Si <email address hidden> wrote:
> High CPU usage only when application is maximized. Graphs then become
> black.
>
> Hardy Heron 8.04, alpha 4, all updates...
On Jan 20, 2008 2:10 PM, Andrew Conkling <email address hidden> wrote:
This bug is about performance in Gutsy and before. Hardy's Resources tab
uses some new Cairo rendering for smooth graphs, and those
performance problems are known.
| Bryan Quigley (bryanquigley) wrote : | #31 |
> Hardy's Resources tab uses some new Cairo rendering for smooth graphs, and those
> performance problems are known.
Is there a separate bug report for that?
| Gadget Boy (gadgetboy99) wrote : | #32 |
This problem on hardy appears recently, it was not there just after the introduction of the smooth graphs
| Andrew Conkling (andrewski) wrote : | #33 |
Gadget Boy, this problem predates the smooth graphs introduced in Hardy. This is about g-s-m reporting high CPU usage for itself, even when not on the Resources tab. This has gotten worse in Hardy, yes, but is about a preceding issue.
| Andrew Conkling (andrewski) wrote : | #34 |
gQuigs, yes, the graph/Resources issue is known upstream: http://
| Mitch Smith (mitchsmith) wrote : | #35 |
By chance do you have an Nvidia graphics card. My test machine was doing the same thing. gnome-system-
| Jonathan Ernst (jonathan.ernst) wrote : | #36 |
I could reproduce this bug with ATI's radeonhd and fglrx driver too. But like you (on another computer) I have no problem using nvidia's nvidia proprietary driver.
| Matthew McGowan (mmcg069) wrote : | #37 |
i expierience high cpu load with the resources tab, and i am using the nvidia-glx-new package.
| Markus Kienast (elias1884) wrote : | #38 |
I have nvidia-glx-new enabled and have high CPU resource usage in gutsy.
Does look much better in hardy. Can go as low as 5% in hardy, amazing
improvement but still kinda sucks!
| Andrew Conkling (andrewski) wrote : | #39 |
On Thu, Mar 27, 2008 at 9:21 PM, Emilio Pozuelo Monfort <email address hidden>
wrote:
> ** Bug watch added: Debian Bug tracker #471152
> http://
>
Thanks, but that's not the right bug. This bug predates the changes in Hardy
and doesn't have anything to do with the changes in the Resources tab.
| Changed in gnome-system-monitor: | |
| status: | Unknown → Confirmed |
| Changed in gnome-system-monitor: | |
| status: | New → Confirmed |
| Andrew Conkling (andrewski) wrote : | #40 |
Linking to correct upstream bug (which I just reported because I couldn't find an existing one): http://
| Changed in gnome-system-monitor: | |
| status: | New → Unknown |
| Andrew Conkling (andrewski) wrote : | #41 |
For the Hardy/Resources problem, see bug #202122, to which I attached the Debian bug also.
| Changed in gnome-system-monitor: | |
| status: | New → Invalid |
| nheinen (nheinen) wrote : | #42 |
CPU usage is 20-80% on my machine(Hardy beta)
It would be nice if GSM used no more cpu than top so the resource tab can actually be used accuratly. At the present time CPU usage on the resource tab is at 80% on an otherwise idle machine, which doesn't help in gaging cpu usage of the rest of the machine.
| Andrew Lambert (andrew-boredomsoft) wrote : | #43 |
Just adding my voice to the choir here. Using Gutsy, GSM uses between 30% and 100% on my 3.4GHz machine. It spikes when updating. I increased the update interval for each section in turn and found that updating the File Systems tab seems to generate the most CPU usage (though, I should point out that I have several drives and partitions of several hundred GB each, so that may work into it.)
Both top and Htop report similar usage stats.
| Andrew Conkling (andrewski) wrote : | #44 |
| snapshot (ossington) wrote : | #45 |
on my laptop using an ATI Radeon RV250 [Mobility FireGL 9000], i have the same problem on the ressource tab, even if I deactivate the smooth checkbox in the prefrences.
However, CPU usage drop below 10% if I reduce the window size. If I enlarge the windows, then Xorg starts eating 100% CPU
| Changed in gnome-system-monitor: | |
| status: | Unknown → Confirmed |
| ScriptBasic (support-scriptbasic) wrote : | #46 |
It seems that when I go full screen with the resource monitor, the CPU usage jumps to 80+ %. If I reduce the size of the window it drops.
John
| TobiasDomhan (tdomhan) wrote : | #47 |
got a really high CPU usage here too
Intel(R) Core(TM)2 Duo CPU T7300 @ 2.00GHz
a Graph for CPU usage should be as seamless as possible. I'm using an Interval of 1 second.
Futhermore I have the gnome panel applet monitor enabled, too, which acts like a CPU mon should, it nearly doesn't use an CPU %.
plus: it shows the CPU grpah before and after opening the System Monitor which shows that the System Monitor produces the most CPU usage of all programs.
don't know if this is a bug, or the program just fails.
resizing the window doesn't affect the usage here.
| Changed in gnome-system-monitor: | |
| status: | Confirmed → Triaged |
| Spudz (sunfish7) wrote : | #48 |
System Monitor chews up to 20% of my CPU. It's really pretty I know, but ...this renders it really useless.
This is either caused by (1) the math-algorithm to smooth the graphs, or (2) the redrawing.
If (1), need to check if the entire curve is re-approximated each redraw. if it is, that's VERY BAD. Only the new point should be adjusted, thus: NewPoint = 0.2 * new_val + 0.8 * LastPoint, or something. That's called an IIR filter if anyone's interested.
If (2), I suggest
a) changing the readout to hospital cardiograph style. (reading moves from left to right, and wraps)
b) lower refresh rate to 5fps, draw a bunch of samples each time
c) if you _really_ want the whole thing to move, blank and repaint each point rather than blanking the area and redrawing
This would be fastest, and smooths:
const WIDTH 500
int val[WIDTH];
int x = -1;
float y = 0;
void plot_new_point(int newVal)
{
x++;
if (x > graphWidth)
x = 0;
float y_old = y;
y = 0.8 * y_old + 0.2 * newVal;
SetPixel( x, val [x], BACKGROUND_COLOR );
val[x] = y;
SetPixel( x, val [x], LINE_COLOR );
}
Sorry can't implement. 1) I'm a noob. 2) RSI. 3) ToDo list spans till xmas.
Sam/Ohmu
| YannUbuntu (yannubuntu) wrote : | #49 |
- Gnome System Monitor of YannUbuntu (blocked at 100%, then 1s peaks, then stable at ~70% Edit (56.4 KiB, image/png)
First thanks to all Gnome developpers! I really love GNOME :)
I have the same bug on Ubuntu 8.10 Intrepid : g-s-m uses between 18% to 100% of my CPU.
I have a Mobile AMD Sempron 3200+.
Then I changed the sample frequency to its minimum both on "Processus" and "Ressources" tabs. I saw the following:
- when I just look at the "Ressources" tab, it is generally stable at 60% +or- 10%
- when I just look at the "Processus" tab, g-s-m uses between 20% to 60% on the "Processus" tab. But:
- when I stay ~15seconds on the "Processus" tab and then see the total CPU use, there are 2 cases:
(1) Peaks from ~10% to 60% every second, which is normal I think because it corresponds to the sample frequency of the "Processus" tab.
(2) sometimes the CPU use is blocked to 100% (which does not correspond to the "Processus" tab value that was 20%~60% as I said before), and remains blocked at 100% during 0~10sec from the moment I switched to the "Ressources" tab.
I hope this can help to debug...
Regards,
| sails (sailsandwaves) wrote : | #50 |
One more voice to sing the song :-p I have a p4 with 2.6 Ghz and2 times 500 of ram runing in paralelle
Yet I have noticed this problem seems to be related to the graphics in ubuntu rather than to the cpu monitor its self
As i get the same kind of processor abuse with any and all graphical use,
for example movies that I can watch in windows 2000 ( full screen) with high yet acceptable cpu usage (60->80%)
in ubuntu even in small aplets ittakes 100% of my cpu and even often leaves me with several seconds of delay for any other programes I might use ; and in full screen the picture and sound will desync and inter reaction with any programes becomes a time warp game
| Björn Rabethge (b-rabethge) wrote : | #51 |
I can confirm this bug for 9.04 beta and also observed it with 8.10 on many different machines. CPU usage of g-s-m is way out of where it should be for a little helping task.
| Paolo Benvenuto (donpaolo) wrote : | #52 |
I can confirm that even the multiload applet drains 50% cpu when I'm not doing nothing on my core2 duo 2.8 GHz
| Paolo Benvenuto (donpaolo) wrote : | #53 |
| Manish Sinha (मनीष सिन्हा) (manishsinha) wrote : | #54 |
- Gnome-System_Monitor.png Edit (14.7 KiB, image/png)
Here is what am getting, managed to capture it instantly.
| Redundant Username (cartoons99) wrote : | #55 |
I tried to use g-s-m to see what was slowing down my system. It turned out to be my screenlets.
G-S-M uses more resource than firefox does! It used almost all of my ram and all of my CPU. Then it wouldn't close no matter what I did. I finnaly got it to close my ending it's own proccess. A resource monitor shouldn't use up all of a systems resources!
| tomek kochaniec (tomekochaniec) wrote : | #56 |
nice but i reinstall my system on ubuntu 9.04 beta to ubuntu 9.04 rc
.problem never return. At me tracket take all ram and CPU sa i close him
every restart system and bug never back. In new wersion on ubuntu 9.04 rc
| Peter van der Sar (peter-vandersar) wrote : | #57 |
This bug is also present in Ubuntu 9.10 (Koala).
Sometimes the g-s-m uses 100% cpu.
I don't think that this bug is a duplicate of https:/
| snibgo (snibgo) wrote : | #58 |
My experience:
1. Top is reporting that root running Xorg takes 24% of CPU.
2. Start System Monitor on processes,
Top reports Xorg 30%, gnome-system-mo 7%.
3. I press System Monitor Resources tab, and top shows Xorg 53%, gnome-system-mo 9%.
So the System Monitor Resources tab takes (53 + 9 - 24) = 38% of CPU resources.
Minimising System Monitor makes no difference to top.
4. Edit, Preferences, Resources, "Update interval in seconds" is set to 1, but it is clearly updating much more quickly than that. Changing to "15 seconds" slows the update to about 1 second, and top reports Xorg 24%, gnome-system-mo 1%. Change "Update interval" to "30", and it updates every 2 seconds, with no great effect on top's reports.
My conclusion: the System Monitor Resourses update interval is broken, and should generally be set to 15.
Note: all top numbers given here are after the system has settled down.
Ubunto 9.04 jaunty
System Monitor 2.26.0.1
Pentium(R) Dual-Core CPU T4300 @ 2.10GHz
| draco (draco31-fr) wrote : | #59 |
On my side, the "update interval" is correct, the graph respects the scale on the lowest bar.
But about CPU usage, I've got the same behaviour.
Before launching Gnome-System-
When I run gnome-system-
Switch the "update interval" to 15'' decreases the CPU usage to 1 - 2% for the each, but the graph is dramaticaly slowed down.
When I go to the "Process" tab, the CPU usage grows fast to above 50% after reverting back to 10% of CPU. It is the same when I launch gnome-system-
This is very annoying if you want to kill a process that already consumes to much CPU !
I also use the system monitor applet, and is showing the same graphs (and even more) and it is using less than 1% of CPU.
All CPU usage are for the all CPU capacity of my i5-750. That means 100% of CPU usage shows that all 4 cores are used at 100%.
| suavi (suavii) wrote : | #60 |
- High Cpu usage of system monitor Edit (103.4 KiB, image/png)
It's still a big problem!
When you are talking about the low CPU usages of Ubuntu, you can't show it to your friend because of system monitor make it as unthinkable.
Here my high CPU usage screen shot because of system monitor. Only system monitor is active.
My CPU is Intel Core 2 Duo T9550 (6M Cache, 2.66 GHz, 1066 MHz FSB)
In windows it's only %1-2. :(
| fsando (fsando) wrote : | #61 |
I don't know if this is a clue but it looked very strange:
Some time ago I noticed that every time I checked processes with gnome system monitor ntop would use a lot of cpu (50-100%). When I killed ntop system monitor would be killed too! It happened consistently. Eventually I removed ntop in synaptics. After that system monitor would use 80-90% cpu and it took several seconds to resize its window. I then reinstalled ntop and now it runs normal 5-20% cpu, I can kill ntop without side effect.
Still ntop is apparently started automatically by system monitor (apparenatly also other *top utilities like atop)
| trampster (trampster) wrote : | #62 |
System Monitor uses about 20% cpu on my machine. There is no way that this is necessary. This bug has been open since 2007 its now 2010. It makes ubuntu look crap, unprofessional and slow. Windows seems to do the same job only using only a fraction of the cpu time. All it needs to do is update a graph/list onces a second, I mean come on people this is not rocket science.
A system monitor is such a basic part of an OS. If you can't even get that right.....It's not a good look.
| eZFlow (breakdevize) wrote : | #63 |
System Monitor needs some serious tweaking ASAP! It's a resource hog.
| Bakhelit (bakhelit) wrote : | #64 |
On my system (Ubuntu 9.10 upgraded from 9.04 clean install) with Intel C2D T5600 (1.83 GHz) I get CPU usage 6-8% for System Monitor alone when I just left it running. It is quite high, especially compared to Win as many people above mentioned (even higher than my Firefox full of addons with couple of tabs opened), but the real problem is when I switch to "Resources" card/tab (with those nice usage graphs:). Than the CPU usage goes to 100% for one core and I guess the only think which keeps my machine from freezing totally is that System Monitor is not able to use multicore CPUs so I can switch back to "Procesess" tab or close the System Monitor.
It is not so serious bug I agree, but it's not looking good especially with the new "Ubuntu is lightware" slogan. It is also quite annoying when you just want to check how many MB you downloaded/uploaded on "Resources" card/tab. I think the nice smooth graphs may be the cause, so it should be optimised or replaced by some less resource consuming graphs even if those would not look so nice (just my opinion).
| Bakhelit (bakhelit) wrote : | #65 |
I discovered some more:
- It is definitely caused by graphs (as Spudz wrote on 2008-11-12).
- Resource consumption doesn't depend only on graph update interval, but also on graph size if I unmaximize the System monitor window (to size 550x412 px - lowest possible) graphs are smoothly running (without lags and with 90-100% CPU usage on one core) even if I let it run for 60+ sec=whole interval is used for graph. In maximized window (size 1647x1000 px) graphs start to lag after 20 or 22 sec with 100% CPU usage on one core. Update interval was 1 sec in both cases.
- If I use update interval of 5 or 10 sec overall CPU usage gets lower but on System Monitor panel applet I can see that there are still spikes utilising 40-50% of one CPU core=It still uses too much resources, especially considered that between the spikes CPU usage is 20-30%. Also graphs updated in 10 sec intervals are not so useful, but it seem to me that it is somehow interpolating the values for graphs between 10sec updates or the update interval is is incorrect (as snibgo wrote on 2010-02-20) - 12 or 13 sec caused graph to move approx. each 1 sec.
I hope this helps developers with debugging.
| YannUbuntu (yannubuntu) wrote : | #66 |
- CPUuse according to update interval (0.25 then 0.5, 0.75, 1s) Edit (111.6 KiB, image/png)
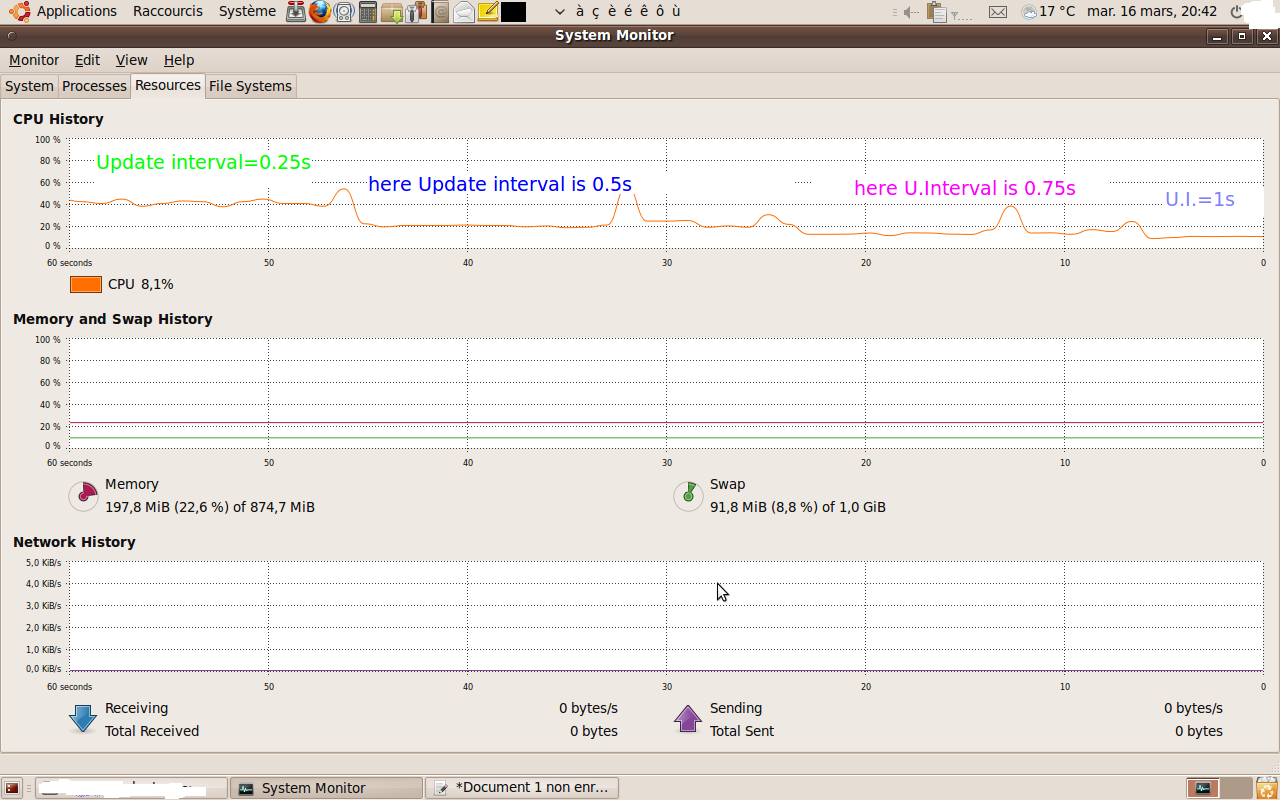
new test with Karmic:
- open System Monitor, Resource tab, set Update Interval to 0.25s during 10 seconds, then 0.5s, then 0.75s, then 1s. You will see on the attached screenshot that the longer the UpdateInterval, the more the CPU used by the graph. Note that with 0.25s it uses 40%CPU, then 0.5s uses 20%, then 0.75s uses 15%, then 1s uses 10%.
- I confirm what is said above: if System Monitor (Resource tab) is max size, it uses 20%CPU for me; if I reduce the S.M window, it only uses 15%. See "max window versus small window" screenshot.
- When I switch between Resources tab and Processes tab, I sometimes observe a strange 100% CPU peak during the moment I am in the Processes tab: see "Processes tab VS Resources tab" screenshot.
- I could not reproduce the long 100% CPU use bug (http://
| YannUbuntu (yannubuntu) wrote : | #67 |
| YannUbuntu (yannubuntu) wrote : | #68 |
| YannUbuntu (yannubuntu) wrote : | #69 |
By the way, I discovered I had an error when launching with the terminal, I don't know if it is related:
~$ LANGUAGE=en_US.utf8 gnome-system-
** (gnome-
| Johansen (johansense) wrote : | #70 |
Forget the graph for a second, just scroll the processes tab up and down quickly, that will surly max out any processor.
| Bakhelit (bakhelit) wrote : | #71 |
Yes scrolling is using CPU a lot, but it's not only in System Monitor, but also in Nautilus, Firefox and other applications, so its probably not a bug (but it would be nice to optimize it:).
| Joe le Kiffeur (joelekiffeur) wrote : | #72 |
This bug also affects me with a higher configuration than other users.
| Changed in gnome-system-monitor (Ubuntu): | |
| status: | Triaged → Confirmed |
| ashgtx (ashwinhgtx-yahoo) wrote : | #73 |
It slows down the system so much that VLC drops frames when playing videos.
| Kari Aliranta (kpaliran) wrote : | #74 |
I get this bug in Lucid, and:
- the excessive CPU usage is about evenly divided between Gnome system monitor and dbus-daemon
- Setting update intervals doesn't have any effect, neither does choosing different tabs from the system monitor
| Bakhelit (bakhelit) wrote : | #75 |
I can confirm this behavior as well on all my computers (laptop with C2D T5600, desktop with Athlon 64 3000+, desktop with Athlon XP 2000+) which I recently updated to Lucid.
One more thing, probably not related to this bug, but quite annoying is that on one computer the System Monitor window is stretched over the panel. So when you start the System Monitor it hides the panel and the window ignores all attempts to resize or move it (I tried using all the keyboard shortcuts - which are working on other windows but the System Monitor) - only thing which works is close or minimize. Sometimes attempts to move the window especially using expo results in the excessive CPU usage.
| W. Bourgeois (roundsoftstudio) wrote : | #76 |
Three years have passed and nobody seems still concerned...
| Vish (vish) wrote : | #77 |
Joe le Kiffeur ,
The bug had been marked "Triaged" which means it has sufficient info for a developer to start working on the bug.
By setting it from triaged to confirmed , the bug status was effectively lowered.
For more info about bug status: https:/
| Changed in gnome-system-monitor (Ubuntu): | |
| status: | Confirmed → Triaged |
| nandayo (casier) wrote : | #78 |
Can you believe we are in 2010, this bug was opened in 2007 and gnome-system-
| JohnL (jwillar) wrote : | #79 |
It's amazing how this problem has been so persistant with Ubuntu (CPU jumping to 90-100%), I wish I could help resolve it but I'm not a coder. However, I can share my work around; I uninstalled 'gnome-
| YannUbuntu (yannubuntu) wrote : | #80 |
As a workaround, what about decreasing the update frequency by default ?
(e.g. 5s, so that by default the bug is less painful, and users who want can increase the frequency )
| Changed in gnome-system-monitor: | |
| importance: | Unknown → High |
| JohnL (jwillar) wrote : | #81 |
My last entry (#79) I suggested fix turned out to be short lived. Changing the frequency also gave false hope of a fix. I spend 30 hours since trying to better understand this issue. I've installed Ubuntu 10.04 and Mint 9 on old then new HDs thinking it was drive related. I installed older and current versions of each OS all w/o real success. I use the Terminal command "ps ux" to watch the CPU% slowly climbed to 100% over a short period of time. When I final discovered there is a memory leak in glx (?) relating it back to the Nvidia drivers (BUG/565981 Report); Apparently the ATI driver has been fixed now and hopefully the Nvidia soon. Bottom line, I did one last fresh install of Mint 9 and after learning that older Nvidia drivers were going to work w/my Nvidia video card, I followed the guide to manually install Nvidia's "nouveau" driver (per http://
| Mike (bild85) wrote : | #82 |
I've seen Gnome System Monitor take up to 140%(!) CPU resources (according to the Gnome System Monitor...) on 64-bit Meerkat running on a 2010 MacBook Pro with quad-core 2.66 GHz processors and 4Gib of RAM. Wow. My lap gets hot!
| Zentai Andras (andras-zentai) wrote : | #83 |
I also got excessive CPU usage.
One possible workaround could be to open a terminal and run the 'top' command.
(I know it is not so fancy, but still does the job. :-)
| Uli Grafenstein (uli-von-grafenstein) wrote : | #84 |
I was fighting with those excessive CPU usage over the last days, too. It occurred after upgrading to Lucid, and as most of the subscribers, I suspected g-m-s. However, I started, by incidence, a session of another user, which was almost virgin and did not show this high CPU usage. So I tried to figure out, what could be the difference and, by luck, I stopped remote control (vinagre) in my session which brought me back to almost 0% CPU usage. I then tried the different options for vinagre and found that it was the notification icon (put to only show up when somebody is connected), which caused the the high CPU usage. All works fine with either no or permanent notification.
However, I could not reproduce the high CPU usage afterwards. Maybe a matter of the sequence, so whether g-s-m is stqrted after or before vinagre.
Hope this helps at least some of the affected.
| draco (draco31-fr) wrote : | #85 |
I presume I don't have vinagre in background (no such thread), and I still have the problem of high CPU usage from g-s-m.
I also notice the same behaviour with the last version of the xfce cpu monitor released with xubuntu maverick.
Here again, there is an new graph added, showing the CPU consumption. What a coincidence !!
Maybe g-s-m is not the responsible directly, but the library used for printing the graph, or an another common function with xfce4-taskmanager ?
| Gaz Davidson (garethdavidson) wrote : | #86 |
Disclaimer: I know nothing of GTK or Cairo.
First up, the source:
http://
This comment:
// FIXME:
// on configure, g->frames_per_unit = g->draw_
// knock FRAMES down to 5 until cairo gets faster
This value is set to 10, not 5. I haven't profiled it, but that comment would suggest cairo_curve_to is the problem. The canvas appears to be stateless, redrawing everything every frame. The obvious solution is to implement a cache for the graph rather than blaming Cairo for the speed.
Cairo must have ways to manipulate graphics buffers. Keep two around as part of the load graph state, one for the background and one for the graph. Draw in a cyclic manor each frame like so:
1) Work out a width based on the last drawn position and the current one. Blank it out from left to right, wrap around if necessary.
2) Draw the line segments from the last drawn position to the current "cursor position"
3) Stamp down the graph background onto the canvas
4) Draw the line segments in two halves, giving the illusion of a scrolling buffer
This will remove 99.9% of the smooth line drawing calls, it will cost a small memory cache, but that's the reason we have RAM anyway.
Workarounds:
a) Do as the comment says, set frames_per_unit to 10 instead of 5, this will draw less line segments. This will call g_timeout_add with a larger interval.
b) Set the default /apps/procman/
c) Draw jagged lines instead of smooth ones, this may be faster.
| Thomas Weiler (thweiler) wrote : | #87 |
- g-s-m or top bug.png Edit (200.9 KiB, image/png)
Hi,
Important things first: I am not an expert and I am not a native speaker ;-)
But maybe I have hint about what could be going on here.
A short story about my problems with gnome-system-
I have used g-s-m on various machines and with diffrent Systems (Debian, Ubuntu, Fedora). I never had the problem with too high cpu usage until I bought a ThinkPad Edge last summer. I had on this machine Debian and Fedora (13 and 14). Everything worked fine exept the problem with g-s-m which this Thread is about.
So after 3 diffrent Systems I gave up and decided too use g-s-m no more. Instead of g-s-m I simply used top in the terminal.
Of course I used top only if I needed it and then only for a short time. G-s-m was ALWAYS running (task bar) !!!
After one week of happiness the following happened: I used top and it said 99,6% cpu usage for TOP!
I didnt touch the system (exept of the screenshot) for a few minutes. After one minute the cpu van started. I waited over one hour -> no change in cpu usage, until I restarted the system . After restart top worked again without any problems.
-> Screenshots
The following things are important:
-> top is a TERMINAL application so whatever causes the cpu usage has nothing to do with drawing lines in an X-Window app.
I don't know if g-s-m is based or has something to do with top.
-> If g-s-m has nothing to do with top this is NOT only a bug in g-s-m
-> This could be a general problem with determining the cpu-usage under pretty rare circumstances (dosen't happen very often) ------> Kernel?
I hope something of this makes sense, if somebody wants to know more about my system (processor, ...) just post here.
Thanks for reading
| Michał Gołębiowski-Owczarek (mgol) wrote : | #88 |
@Thomas Weiler
This top issue of yours seems like a different one. Gnome system monitor always eats up CPU whereas top usually doesn't.
| Thomas Weiler (thweiler) wrote : | #89 |
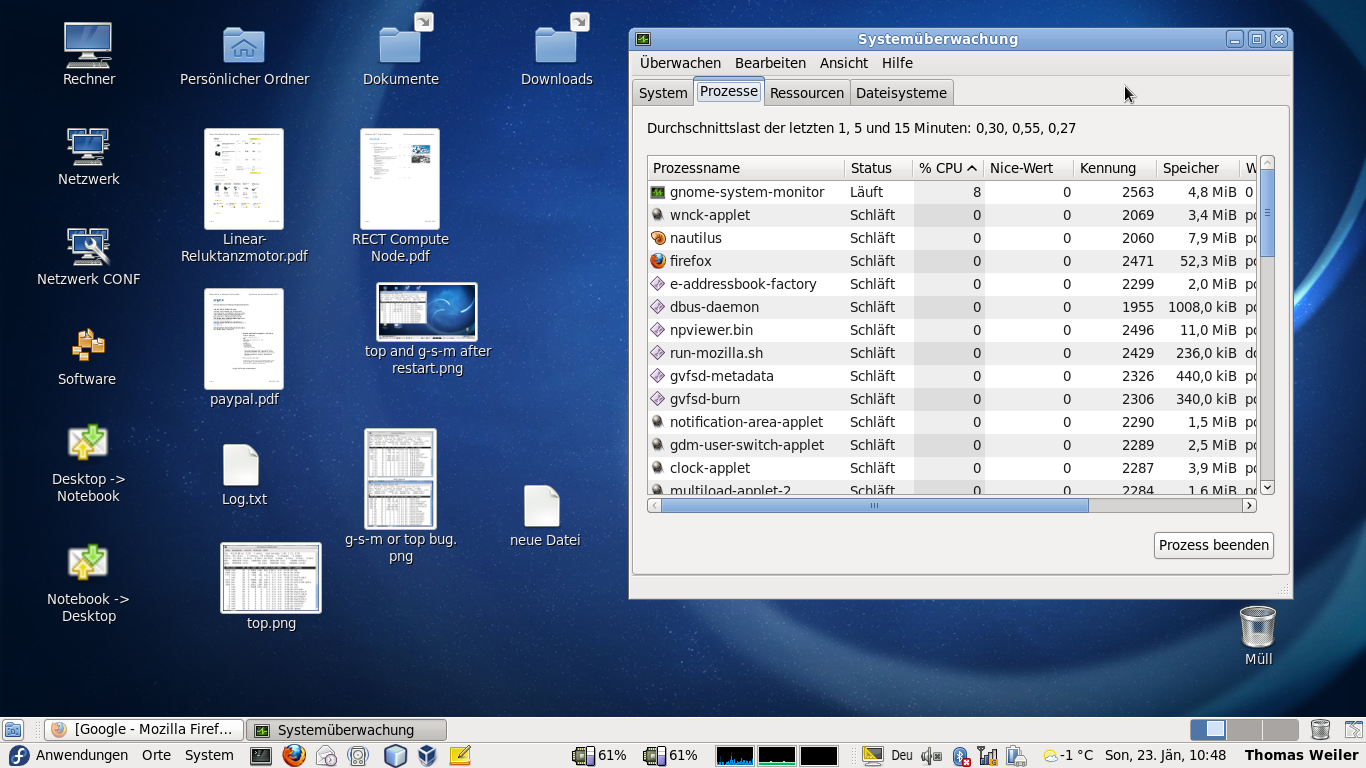
@ Michal Golebiowski
G-s-m works fine on all my machines, even on my ThinkPad Edge (screen shot). Only once in a while I had the problem with the cpu Usage. The attached screenshot shows my ThinkPad (intel U7300) with G-s-m running in the task bar and X-Window, monitoring cpu, ram, network and cpu speeds. Arround 8% for g-s-m with refresh @ 500 ms is the normal condition on my system.
The problems occured only sometimes (two times a month).
On my other machines (debian AMD64 Phenom II, fedora AMD Turion x2) I never had any Problems with g-s-m in years.
So it seems that most machines don't have problems at all, some have problems all the time and some (my ThinkPad) have troubles only once in a while.
I have also tried to use g-s-m and top at the same time. Normally nothing goes wrong but if g-s-m causes trouble and I use top at the same time, top starts using 99% of the second core (g-s-m 99% of the first) and the system is nearly frozen.
Greetings from Austria
| Michał Gołębiowski-Owczarek (mgol) wrote : | #90 |
@Thomas Weiler
This 8% is not everything, if I switch to the "Resources" tab I see CPU usage of about 15-20% on each core which is a lot considering I'm not running anything computionally complex. On my older laptop it was a lot more than this 15-20%, it reached 50-70% IIRC. Besides, it's not only a g-s-m process, Xorg also counts as it suffers from excessive calls from g-s-m. Each a few seconds/a minute there is also a peak: g-s-m to about 25%, Xorg to about 50%.
You obviously have a different issue so if you want to report it create a separate bug report.
| Thomas Weiler (thweiler) wrote : | #91 |
@ Michal Golebiowski
Hi, sorry i am a little bit confused now.
If you scroll to the top of this page you can read the original bug description from Jonathan M. in 2007.
He wrote: "Gnome System monitor sometimes claims to be using all of the spare capacity of my CPU, I cannot pinpoint when it happens, but it does happen. I pressed the report bug button while it was using 86% of my CPU according to itself, but now a few minutes later, it has settled on 11%."
This is exactly the same problem which I have on my ThinkPad nearly four years later.
G-s-m might not be very efficient (using 15-20%) but this is not a bug "just" permanent inefficiency.
I posted my problem here because I discovered that top also shows this behaviour sometimes and maybe this is a hint for somebody who is working on this problem or g-s-m in general.
I'm new here, so do not hesitate to tell me if I do not understand why I should now create a new bug report.
| Michał Gołębiowski-Owczarek (mgol) wrote : | #92 |
@Thomas Weiler
Maybe you're right but that would mean most of alleged dups should be un-dupped, look at their description.
Besides, if you look at the bugzilla report:
https:/
you'll see they claim that the problem is caused by some inefficient updating of the structure displayed so it should not mess up with top. Still, I think this is a different issue, if it somehow happened to be the same it's always possible to mark it as a duplicate then.
| Michał Gołębiowski-Owczarek (mgol) wrote : | #93 |
BTW, the title of this bug would be also misleading.
| David Smith (dave-kts) wrote : | #94 |
I am having simalar problem in 10.10 32 bit superOS (super ubuntu)
intel DP43BF board
Nvidia quadro FX550 using proprietary driver version 260.19.06
Q8300 quad core2
cpu monitor widget and panel app show idle load at normal 5% or so, as soon as I open Sys monitor, cpu load jumps up to 32-38%, showing usage on all 4 cores. all 4 cores. tried increasing refresh rates and other options, no difference.
System monitor also hangs and will not close sometimes, have to use xkill, sometimes a couple times on it to get it to close.
Seemed like it wasnt this bad untill i installed the latest updates, and i thought one was related to the GSM or something to do with gnome
| Josh Leverette (coder543) wrote : | #95 |
this is really odd. "Top", the terminal command, uses like 0.2% to monitor everything g-s-m monitors. Why does g-s-m use a full 20% or more? very strange indeed.
| Simon Rijk (s-p-rijk) wrote : | #96 |
Same here: Gnome System Monitor at 48%!
Ubuntu 12.04 on a Intel(R) Core(TM) i7 CPU Q720 @ 1.60GHz
| tags: | added: precise |
| REL (i--am--) wrote : | #97 |
i've been having this bug since the beginning of time on different amd and intel systems. very annoying this has not been fixed after all this time...
| Samael (singingbush) wrote : | #98 |
- screenshot of problem - Ubuntu 12.10 Edit (110.2 KiB, image/jpeg)
I've been experiencing this same issue. I saw gnome-system-
I've attached a screenshot showing high CPU usage.
I'm using a relatively old Belinea laptop with an Intel Core2 Duo T7100 processor and 2GB of memory.
Ubuntu 12.10 (quantal) 32-bit
Kernel Linux 3.5.0-21-generic
Gnome 3.6.0
| Changed in gnome-system-monitor: | |
| status: | Confirmed → Fix Released |
| Rael Gugelmin Cunha (rael-gc) wrote : | #99 |
I'm experiencing this bug, in a core i7 machine, with 16gb RAM. Gnome system monitor still uses 50% most of the time when opened.
| Sebastien Bacher (seb128) wrote : | #100 |
| Changed in gnome-system-monitor (Ubuntu): | |
| status: | Triaged → Fix Committed |
| assignee: | Ubuntu Desktop Bugs (desktop-bugs) → nobody |
| Kevin (kevis) wrote : | #101 |
FWIW, on my (6-year-old) desktop under 14.04 LTS running on an "Intel® Core™2 Duo CPU E7200 @ 2.53GHz × 2" System Monitor still takes around 20-30% CPU time (I checked both g-s-m and top).
I have two bits of useful debugging info:
First, if I change the update interval to 3s CPU usage in g-s-m stays around 8%. At around 6s it falls to 1%.
Leaving the update interval at its fastest (1s), if the Processes tab is selected but I remove all columns from view (no processes are actually shown), the cpu usage of 20-30% is still there. But if I move to the Resources tab CPU usage goes down significantly, to <5% consistently, yielding instead to 5-20% CPU utilization in Xorg depending on how big the window is. Since the only thing left showing the Processes tab is the average load for 1,5,15 min I'm wondering if it somehow has to do with that, or if g-s-m is doing extra work on this tab that it isn't doing on others.
| eZFlow (breakdevize) wrote : | #102 |
They should write a completely new and lightweight monitor, something like
windows 8 has done.
On 25 Aug 2014 16:26, "Kevin" <email address hidden> wrote:
> FWIW, on my (6-year-old) desktop under 14.04 LTS running on an "Intel®
> Core™2 Duo CPU E7200 @ 2.53GHz × 2" System Monitor still takes around
> 20-30% CPU time (I checked both g-s-m and top).
>
> I have two bits of useful debugging info:
>
> First, if I change the update interval to 3s CPU usage in g-s-m stays
> around 8%. At around 6s it falls to 1%.
>
> Leaving the update interval at its fastest (1s), if the Processes tab is
> selected but I remove all columns from view (no processes are actually
> shown), the cpu usage of 20-30% is still there. But if I move to the
> Resources tab CPU usage goes down significantly, to <5% consistently,
> yielding instead to 5-20% CPU utilization in Xorg depending on how big
> the window is. Since the only thing left showing the Processes tab is
> the average load for 1,5,15 min I'm wondering if it somehow has to do
> with that, or if g-s-m is doing extra work on this tab that it isn't
> doing on others.
>
> --
> You received this bug notification because you are subscribed to the bug
> report.
> https:/
>
> Title:
> Excessive CPU usage by Gnome System Monitor
>
> Status in The GNOME System Monitor:
> Fix Released
> Status in “gnome-
> Fix Committed
> Status in “gnome-
> Invalid
>
> Bug description:
> Binary package hint: gnome-system-
>
> Gnome System monitor sometimes claims to be using all of the spare
> capacity of my CPU, I cannot pinpoint when it happens, but it does
> happen. I pressed the report bug button while it was using 86% of my
> CPU according to itself, but now a few minutes later, it has settled
> on 11%.
>
> System info:
> CPU: Intel Celeron 2.6 ghz
> RAM: 768 mb
> Distro: 7.04 (fully updated)
>
> ProblemType: Bug
> Architecture: i386
> Date: Mon Mar 19 21:40:54 2007
> DistroRelease: Ubuntu 7.04
> ExecutablePath: /usr/bin/
> Package: gnome-system-
> PackageArchitec
> ProcCmdline: gnome-system-
> ProcCwd: /home/jonathan
> ProcEnviron:
> LANG=en_DK.UTF-8
>
> PATH=/usr/
> SHELL=/bin/bash
> SourcePackage: gnome-system-
> Uname: Linux jonathan-desktop 2.6.20-8-386 #2 Tue Feb 13 05:15:43 UTC
> 2007 i686 GNU/Linux
>
> To manage notifications about this bug go to:
> https:/
>
| Bryan Quigley (bryanquigley) wrote : | #103 |
I have an old 32-bit pentium 4. It only uses 3% of the CPU on that. Looks like this is definitely fixed in xenial.
| Changed in gnome-system-monitor (Ubuntu): | |
| status: | Fix Committed → Fix Released |
| Dirk Kok (d-kok-2000) wrote : | #104 |
Still affects me. It uses a wildly varying amount of CPU, between 15% and 40%, on an AMD Athlon 5000+.
Thank you for your bug. Could you get a backtrace (https:/