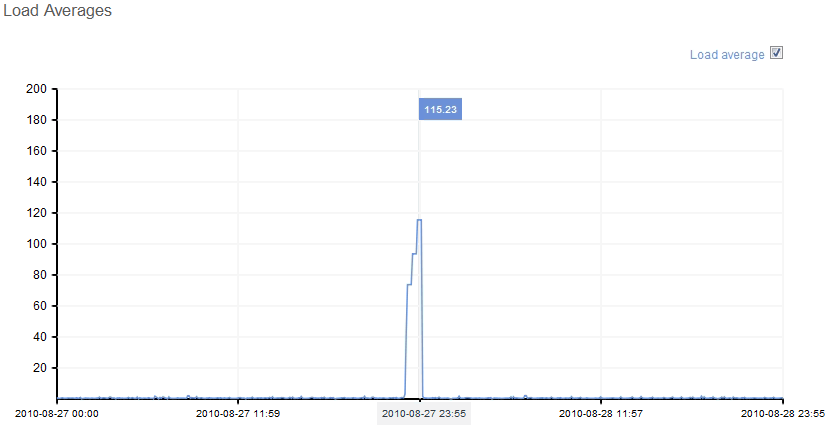
High load averages on Lucid while idling
| Affects | Status | Importance | Assigned to | Milestone | |
|---|---|---|---|---|---|
| DEPRECATED Pantheon |
Confirmed
|
Medium
|
Unassigned | ||
| Linux |
New
|
Undecided
|
Unassigned | ||
| Ubuntu on EC2 |
Invalid
|
Undecided
|
Unassigned | ||
| linux-ec2 (Ubuntu) |
Fix Released
|
Undecided
|
John Johansen | ||
| linux-meta (Ubuntu) |
Invalid
|
Undecided
|
Unassigned | ||
Bug Description
SRU Justification:
Impact:
Fixes loadavg reporting on EC2.
Fix:
This reverts commit 0d843425672f4d2
accounting when a tickless (no idle HZ) kernel is used. However the Xen patchset used
on EC2 is not tickless but the accounting modifications are still being done, resulting
in phantom load.
Testcase:
Start any Ubuntu Lucid based instance on EC2, let it idle while logging the load average.
while true ; do cat /proc/loadavg >>load.log ; sleep 5 ; done
Alternately simply run top or htop and monitor the load average.
Without the revert the reported load will vary from 0 up to about .5 for a clean image
with no extra tasks launched.
With the revert the load stays steady around 0 with only occasional small bump when
a background task is run.
ami-2d4aa444
Description: Ubuntu 10.04 LTS
Linux domU-XX-
Description copied (and edited) from post at http://
Posted as a bug here as I'm not the only one experiencing these issues, see very similar post at http://
-------
I've been running a customised version of an Intrepid image by Eric Hammond for a long while now and decided it was time to upgrade so I've configured a fresh image based on the official Lucid 32-bit in us-east (ami-2d4aa444). And I'm having some strange issues.
I run on a c1.medium instance and normally expect a load average of between 0.2 and 0.6, roughly averaged throughout the day, with spikes usually no more than about 2.0. So it's fairly relaxed. When all my services are shut down the load averages go down to ~0.0.
Now I'm on to Lucid I'm getting load averages that are roughly 10 times higher than I expect it to be, hovering between around 1.8 and 2.5 and I can see no reason why it should be reported this high. There are no processes hogging CPU, just occasionally coming in and out, watching 'top' doesn't reveal anything obvious and it just looks like a major disconnect between the activity and the load averages. I can't catch any processes running uninterruptable [ ps auxw | awk '{if ($8
== "D") print }' ].
If I run my custom image without any of my services running, load averages hover between approximately 0.1 and 0.6, nothing like the ~0.0 I used to get with nothing happening; I can't see any reason for it moving but it goes up and down, apparently at random. I've tried the same thing on a fresh instance of ami-2d4aa444 and it does roughly the same thing so it doesn't seem to be anything I've done ontop of the base image.
When I start my services it shoots up to the ~2.0 levels, even though they don't do much work, although they do take up a fair bit of memory. I've tried swapping to a new instance but it's the same.
The main applications run on this server are Apache, MySQL and a bunch of separate Tomcat (Java) instances. I have a number of EBS volumes mounted, a combination of ext3 and XFS.
Here's a [ top -bn1 | head -20 ] that's taken at random. 'java' and 'mysql' come in and out of the top of the list but never stay for very long.
top - 20:55:35 up 6:47, 3 users, load average: 2.33, 2.35, 2.31
Tasks: 137 total, 1 running, 134 sleeping, 2 stopped, 0 zombie
Cpu(s): 5.1%us, 0.5%sy, 0.2%ni, 93.5%id, 0.3%wa, 0.0%hi, 0.0%si, 0.5%st
Mem: 1781976k total, 1684628k used, 97348k free, 29108k buffers
Swap: 917496k total, 26628k used, 890868k free, 660448k cached
PID USER PR NI VIRT RES SHR S %CPU %MEM TIME+ COMMAND
1 root 20 0 2804 1476 1204 S 0 0.1 0:00.13 init
2 root 20 0 0 0 0 S 0 0.0 0:00.00 kthreadd
3 root RT 0 0 0 0 S 0 0.0 0:00.01 migration/0
4 root 20 0 0 0 0 S 0 0.0 0:00.00 ksoftirqd/0
5 root RT 0 0 0 0 S 0 0.0 0:00.00 watchdog/0
6 root 20 0 0 0 0 S 0 0.0 0:00.01 events/0
7 root 20 0 0 0 0 S 0 0.0 0:00.00 cpuset
8 root 20 0 0 0 0 S 0 0.0 0:00.00 khelper
9 root 20 0 0 0 0 S 0 0.0 0:00.00 netns
10 root 20 0 0 0 0 S 0 0.0 0:00.00 async/mgr
11 root 20 0 0 0 0 S 0 0.0 0:00.00 xenwatch
12 root 20 0 0 0 0 S 0 0.0 0:00.00 xenbus
14 root RT 0 0 0 0 S 0 0.0 0:00.03 migration/1
... looks like a system doing not much, except for those numbers at the top right.
Are these new kernels doing something different to calculate those averages now? The main thing I'd like to know is: are these numbers a true reflection of the load on my server or are they skewed or scaled somehow? I've got used to measuring the utilisation of my servers in the lower numbers, but now I have these large numbers I'm not sure what to make of it. The graphs of my load throughout the day look completely different to what they used to but the workload hasn't changed at all.
-------
Having done a bit more playing my current suspicion is that this is related to the amount of memory being used by running applications. If I install mysql on a base system then the load averages go up and it's using ~140m, apparently the same thing happens if you install postgresql. I've tested on c1.medium and m1.small, the other reporting user is having the same issues on a 64-bit machine (ami-4b4ba522).
See posts at Google groups for more information and data.
Related branches

| Changed in pantheon: | |
| status: | New → Triaged |
| Changed in pantheon: | |
| importance: | Medium → Critical |
| Changed in pantheon: | |
| status: | Triaged → Confirmed |
| Changed in pantheon: | |
| importance: | Critical → Medium |
| description: | updated |
| Changed in linux-meta (Ubuntu): | |
| status: | New → Invalid |
| Changed in ubuntu-on-ec2: | |
| status: | New → Invalid |
Here's my info for an EBS instance with Postgres on it. 2GB of memory are used out of 7.7GB available:
ubuntu@
14:44:17 up 5 days, 16:26, 1 user, load average: 0.79, 1.09, 1.15
ubuntu@
Linux 2.6.32-305-ec2 (domU-12-
avg-cpu: %user %nice %system %iowait %steal %idle
0.01 0.00 0.01 0.03 0.01 99.94
Device: tps kB_read/s kB_wrtn/s kB_read kB_wrtn
sda1 0.90 0.30 6.91 147285 3396124
sdb 0.00 0.00 0.00 385 72
ubuntu@
14:45:15 up 5 days, 16:27, 1 user, load average: 0.77, 1.03, 1.13
ubuntu@