
© 2004
Canonical Ltd.
•
Terms of use
•
Data privacy
•
Contact Launchpad Support
•
Blog
•
Careers
•
System status
•
1b1ed1a
(Get the code!)
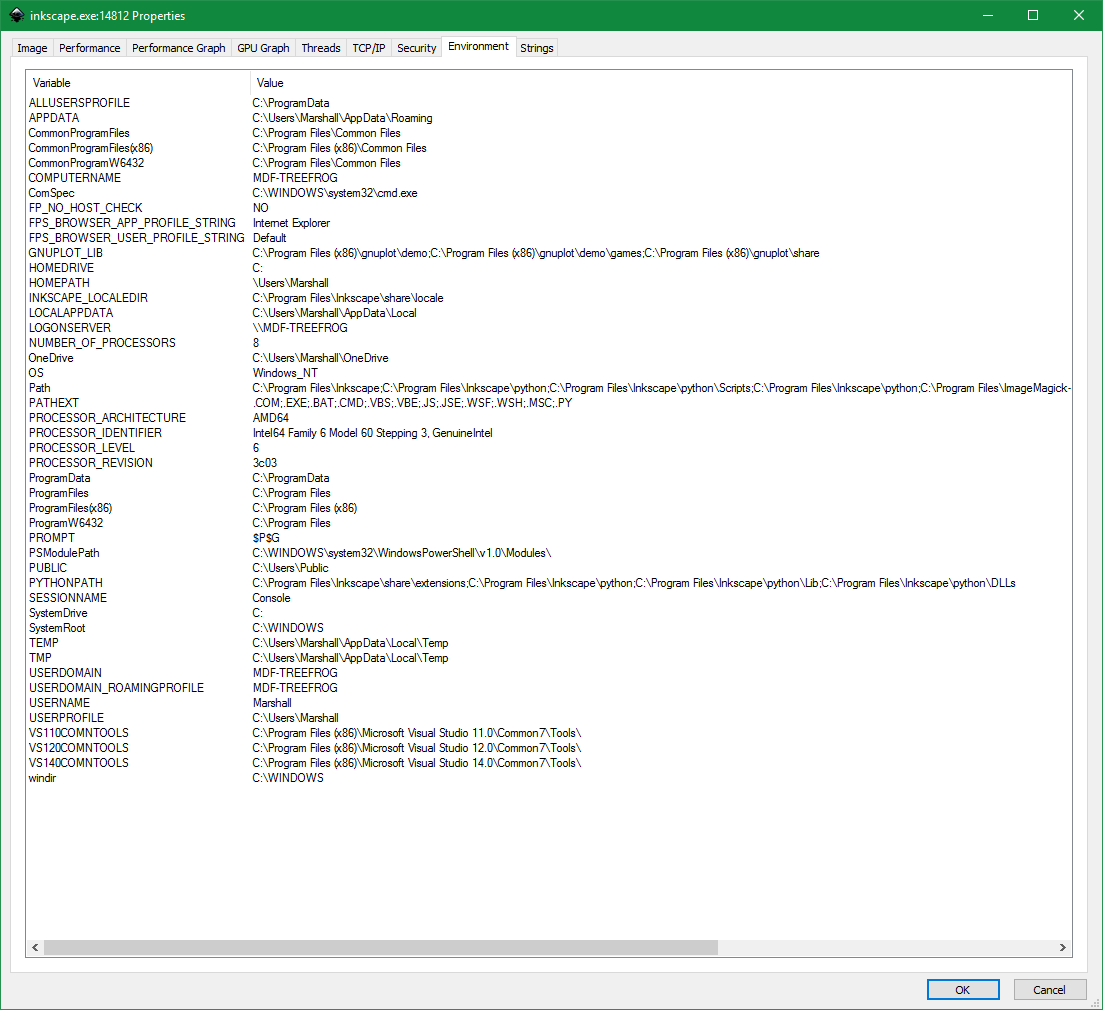
The actual child process thread that is eating cpu will close every time I open properties to the threads tab, so I'm getting nothing from it. But I can see that there are 10 associated threads in the handles view before attempting to open the properties. I've attached a screenshot of the "Environment" tab (same for parent and child process shown in Process Explorer tree view).
From the "parent" inkscape thread properties (obviously the thread # changes every time, but the stacks are the same):
Stack for thread 15860: (inkscape.
ntdll.dll!
KERNELBASE.
inkscape.com+0x30c3
inkscape.com+0x13e8
inkscape.com+0x151b
KERNEL32.
ntdll.dll!
Stack for thread 20748: (inkscape.
Stack for thread 17180: (inkscape.
Stack for thread 14988: (inkscape.
(all three have same stack)
ntdll.dll!
KERNELBASE.
inkscape.com+0x1608
KERNEL32.
ntdll.dll!
Stack for thread 20116: (ntdll.
(This one sometimes goes away while inkscape continues to run)
ntdll.dll!
ntdll.dll!
KERNEL32.
ntdll.dll!