
timeline with multiple categories messed up
Bug #152252 reported by
Mathias Weyland
| Affects | Status | Importance | Assigned to | Milestone | |
|---|---|---|---|---|---|
| ploticus (Ubuntu) |
Fix Released
|
Undecided
|
Unassigned | ||
Bug Description
Binary package hint: ploticus
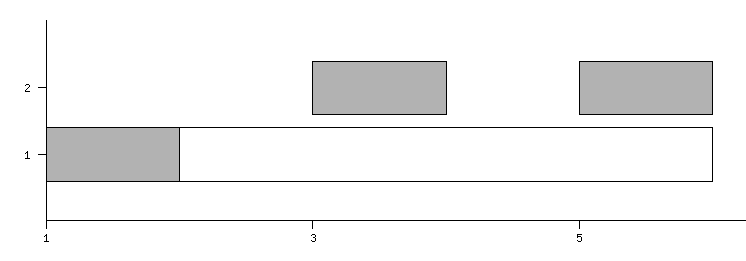
ploticus version 2.33 has a bug which makes multi-dimension timelines impossible to draw. The outline of one bar is always extended to the longest bar. Example:
#proc getdata
data:
2 5 6 "963"
1 1 2 "1327"
2 3 4 "962"
#proc categories
axis: y
datafield: 1
#proc areadef
rectangle: 1 1 9 3
xautorange: datafield=2,3
yscaletype: categories
#proc xaxis
stubs: inc 2 hours
#proc yaxis
stubs: usecategories
#proc bars
axis: x
locfield: 1
segmentfields: 2 3
I'm going to attach samples of how it looks and how it should look as well as a small patch to fix the problem.

| Changed in ploticus: | |
| status: | Incomplete → Fix Released |
To post a comment you must log in.
I'm sorry this comes late, launchpad was very slow yesterday. Here comes the patch to fix it.