Munin "IO Service Time" (iostat_ios) graph gives completely implausible numbers

Bug #919429 reported by Tel
6
This bug affects 1 person
Affects Status Importance Assigned to Milestone
munin (Ubuntu)
Fix Released
Medium
James Page
Precise
Fix Released
Medium
James Page

Bug Description

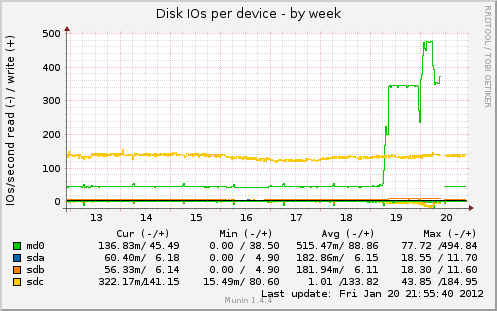
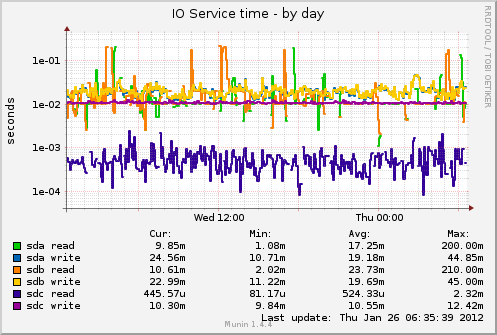
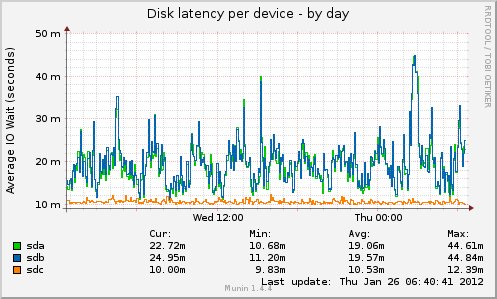
Recently a process wrote lots of data to the disk (and I'll take responsibility for that) but the "Disk IOs per device" went up (makes sense) and the "Disk latency per device" also went up (yup, so far so good) but the "IO Service time" strangely went down! Yes, it showed more latency but less service time. That's incredible. I'm incredulous.

I've been suspicious of this for some time, because I absolutely know that /dev/sdc is a faster device than /dev/sda and /dev/sdb and for a long time it has been showing the lowest latency and the highest service time. It always did seem weird, but now I'm sure these numbers are bogus.

Related branches

Revision history for this message
Tel (lists) wrote :
Revision history for this message
Tel (lists) wrote :

Here is the offending graph, from munin. NOTE: the purple line is the fast drive, and the yellow line is a slower drive, but for some strange reason the yellow line goes DOWN under additional load (should go UP I would expect). Also, the results are completely the other way to the latency graph.

Revision history for this message
Tel (lists) wrote :

Here is the graph of the latency, also from munin. Showing the exact opposite to the other graph. This one gives an answer that I believe is correct (or at least it is plausible). Note that /dev/sdc is the fastest drive, and shows the lowest latency. Also note that when loaded heavily, the latency on /dev/sda and /dev/sdb go up (they are RAID mirror so they move together).

Revision history for this message
Tel (lists) wrote :

Just for reference, here is a graph of IO operations, showing the additional load. The green line is /dev/md0 but that is a RAID mirror of /dev/sda and /dev/sdb so they are taking the load. NOTE: the load on /dev/sdc is constant and would typically be the drive taking the most load. This graph seems very plausible to me.

Revision history for this message
Tel (lists) wrote :

Quite likely the kernel version may be significant here:

Linux version 2.6.32-33-server (buildd@yellow) (gcc version 4.4.3 (Ubuntu 4.4.3-4ubuntu5) ) #70-Ubuntu SMP Thu Jul 7 22:28:30 UTC 2011

linux-headers-2.6.32-33 2.6.32-33.70
linux-headers-2.6.32-33-server 2.6.32-33.70
linux-headers-server 2.6.32.33.39
linux-image-2.6.32-33-server 2.6.32-33.70
linux-image-server 2.6.32.33.39
linux-server 2.6.32.33.39

Also, see attached CPU info, not sure if that changed IOstat stuff, possibly it does.

Revision history for this message
Tel (lists) wrote :

I can see one problem in the file /usr/share/munin/plugins/iostat_ios as follows:

LINE 202: print("${dev}_rtime.value ", ($rtime_diff != 0) ? ($rio_diff / $rtime_diff) : 0, "\n",
LINE 203: "${dev}_wtime.value ", ($wtime_diff != 0) ? ($wio_diff / $wtime_diff) : 0, "\n",
LINE 204: );

Here we see it divides number of IO operations by time in milliseconds. However the graph has the vertical axis in seconds. Dividing by time gives Hz never back to seconds again. So the graph results are really in Hz (not a useful unit given the context we are working with here). I suggest that the calculation should be:

LINE 202: print("${dev}_rtime.value ", ($rio_diff != 0) ? ($rtime_diff / $rio_diff) : 0, "\n",
LINE 203: "${dev}_wtime.value ", ($wio_diff != 0) ? ($wtime_diff / $wio_diff) : 0, "\n",
LINE 204: );

There's another (minor) problem which is to say that returning 0 in a situation where no IO has occurred is a lie, should return NaN or NA but if you read the Munin protocol specification (see link below) it claims "Output must be integer or decimal number," so the have no provision for a plugin saying "hey, this value does not exist right now" and that's strange because the RRD system does support NaN for missing values -- but that's a bigger problem for another day.

http://munin-monitoring.org/wiki/protocol-config

Revision history for this message
Tel (lists) wrote :

http://munin-monitoring.org/browser/trunk/node/node.d.linux/iostat_ios.in?rev=121

(lines 147, 148, 149)

Ha ha, sysadmins have been muddling over bogus values for the past 8 years. No one noticed all the readings were backwards, but I bet there have been plenty of reports handed to bosses over those years with charts fully of meaningless squiggly lines.

Dave Walker (davewalker)
Changed in munin (Ubuntu):
importance: Undecided → High
Revision history for this message
Kenyon Ralph (kralph) wrote : Re: [Bug 919429] Re: Munin "IO Service Time" graph gives completely implausible numbers

On 2012-01-20T23:32:46-0000, Tel <email address hidden> wrote:
> There's another (minor) problem which is to say that returning 0 in
> a situation where no IO has occurred is a lie, should return NaN or
> NA but if you read the Munin protocol specification (see link below)
> it claims "Output must be integer or decimal number," so the have no
> provision for a plugin saying "hey, this value does not exist right
> now" and that's strange because the RRD system does support NaN for
> missing values -- but that's a bigger problem for another day.
>
> http://munin-monitoring.org/wiki/protocol-config

Actually, you can give a value of "U" to mean NaN, or "I have no value
right now". I think it's documented on the munin trac wiki somewhere,
but I can't find it right now, and it's hard to search for.

Regarding this bug, I'm thinking we should disable autoconf for this
plugin, since it is marked "legacy", and its functionality is
duplicated by diskstats. http://munin-monitoring.org/changeset/3003

--
Kenyon Ralph

Revision history for this message
Tel (lists) wrote : Re: Munin "IO Service Time" graph gives completely implausible numbers

Agree that the IO Service time is made somewhat redundant by the Disk Latency graph which shows much the same information. However, IO Service time itemises read and write, and after coming this far, seems a shame not to make the small fix to get it working properly.

Revision history for this message
Tel (lists) wrote :

Here is my suggestion, taking into account the "U" to mean NaN and also I note that you can get deep negative spikes when the counters clock over (unless I'm mistaken they are 32 bit counters, even on a 64 bit kernel, and yes I do seem to have managed to clock at least one over).

LINE 202: print("${dev}_rtime.value ", ($rio_diff > 0 and $rtime_diff > 0) ? ($rtime_diff / $rio_diff) : 'U', "\n",
LINE 203: "${dev}_wtime.value ", ($wio_diff > 0 and $wtime_diff > 0) ? ($wtime_diff / $wio_diff) : 'U', "\n",
LINE 204: );

I've tested this for about half a day and it looks much nicer than the old version, less clutter. When IO is not happening on a drive, the trace goes away, and I think that's what should happen (people might for example use a drive only for backups or some other intermittent activity).

Revision history for this message
Tel (lists) wrote :

For what it's worth, I've attached a graph of the same machine, running normally, with IO Service time over a day, after modification -- no random downward streaks to zero, much more readable, and the numbers actually make sense.

Revision history for this message
Tel (lists) wrote :

Here's the Disk Latency graph as a comparison -- similar information, but not exactly the same.

Revision history for this message
Kenyon Ralph (kralph) wrote :

I applied your suggested changes to the upstream repository: http://munin-monitoring.org/changeset/4610

Thanks!

Revision history for this message
Tel (lists) wrote :

No thank you sir!

The only problem remains how to explain to people that their data has turned upside down after they upgrade. Fortunately that's no problem of mine :-) At any rate, as far as I'm concerned that about fixes this bug...

Revision history for this message
Kenyon Ralph (kralph) wrote : Re: [Bug 919429] Re: Munin "IO Service Time" graph gives completely implausible numbers

On 2012-01-24T02:24:39-0000, Tel <email address hidden> wrote:
> Agree that the IO Service time is made somewhat redundant by the Disk
> Latency graph which shows much the same information. However, IO Service
> time itemises read and write, and after coming this far, seems a shame
> not to make the small fix to get it working properly.

Actually, the diskstats plugin does itemize read and write, per
device, if you click on the top-level graph. So iostat_ios does truly
seem redundant, while producing graphs that don't look as nice and
aren't per-device.

--
Kenyon Ralph

James Page (james-page)
Changed in munin (Ubuntu):
importance: High → Medium
Changed in munin (Ubuntu Precise):
assignee: nobody → James Page (james-page)
status: New → In Progress
Revision history for this message
Launchpad Janitor (janitor) wrote : Re: Munin "IO Service Time" graph gives completely implausible numbers

This bug was fixed in the package munin - 1.4.6-3ubuntu3

---------------
munin (1.4.6-3ubuntu3) precise; urgency=low

  * d/patches/fix_iostat_plugin.patch: Cherry picked patch from upstream
    trunk to correct output of iostat plugin (LP: #919429).
 -- James Page <email address hidden> Tue, 03 Apr 2012 11:31:24 +0100

Changed in munin (Ubuntu Precise):
status: In Progress → Fix Released
Kenyon Ralph (kralph)
summary: - Munin "IO Service Time" graph gives completely implausible numbers
+ Munin "IO Service Time" (iostat_ios) graph gives completely implausible
+ numbers
To post a comment you must log in.
This report contains Public information  
Everyone can see this information.

Other bug subscribers

Remote bug watches

Bug watches keep track of this bug in other bug trackers.