
[karmic] CPU load not being reported accurately
Bug #513848 reported by
Peter Matulis
This bug affects 1 person
| Affects | Status | Importance | Assigned to | Milestone | |
|---|---|---|---|---|---|
| linux (Ubuntu) |
Fix Released
|
Low
|
Chase Douglas | ||
| Karmic |
Fix Released
|
Low
|
Chase Douglas | ||
Bug Description
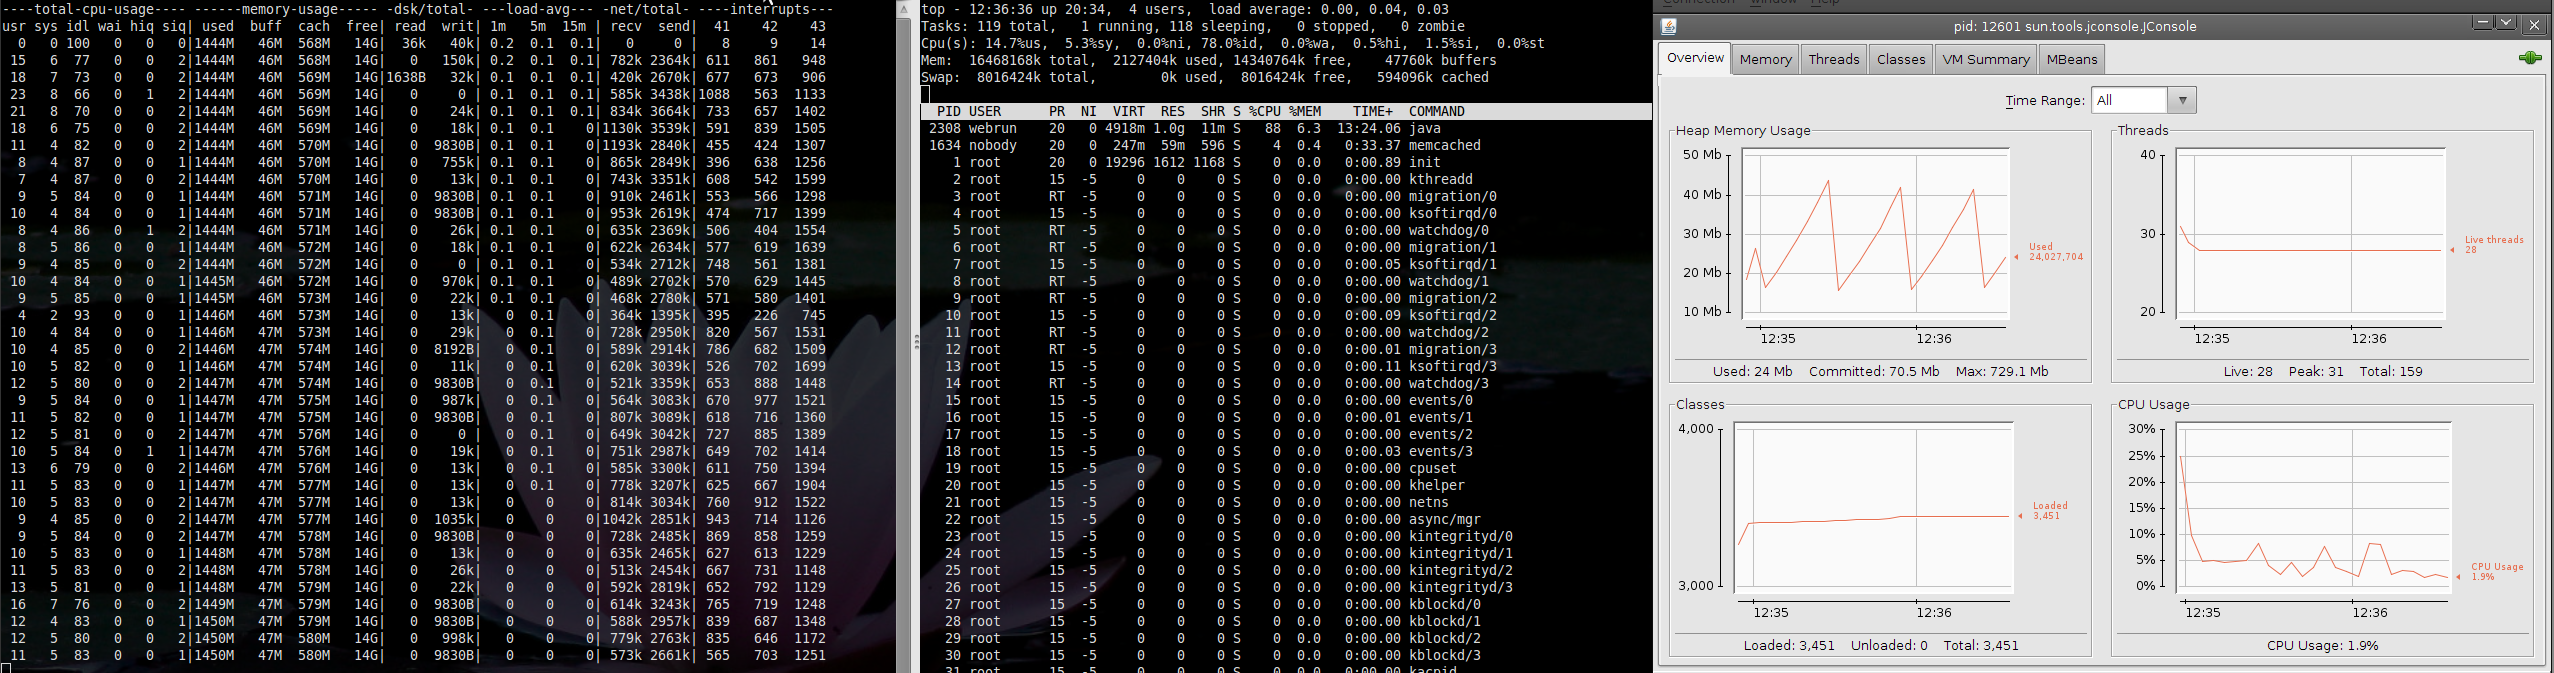
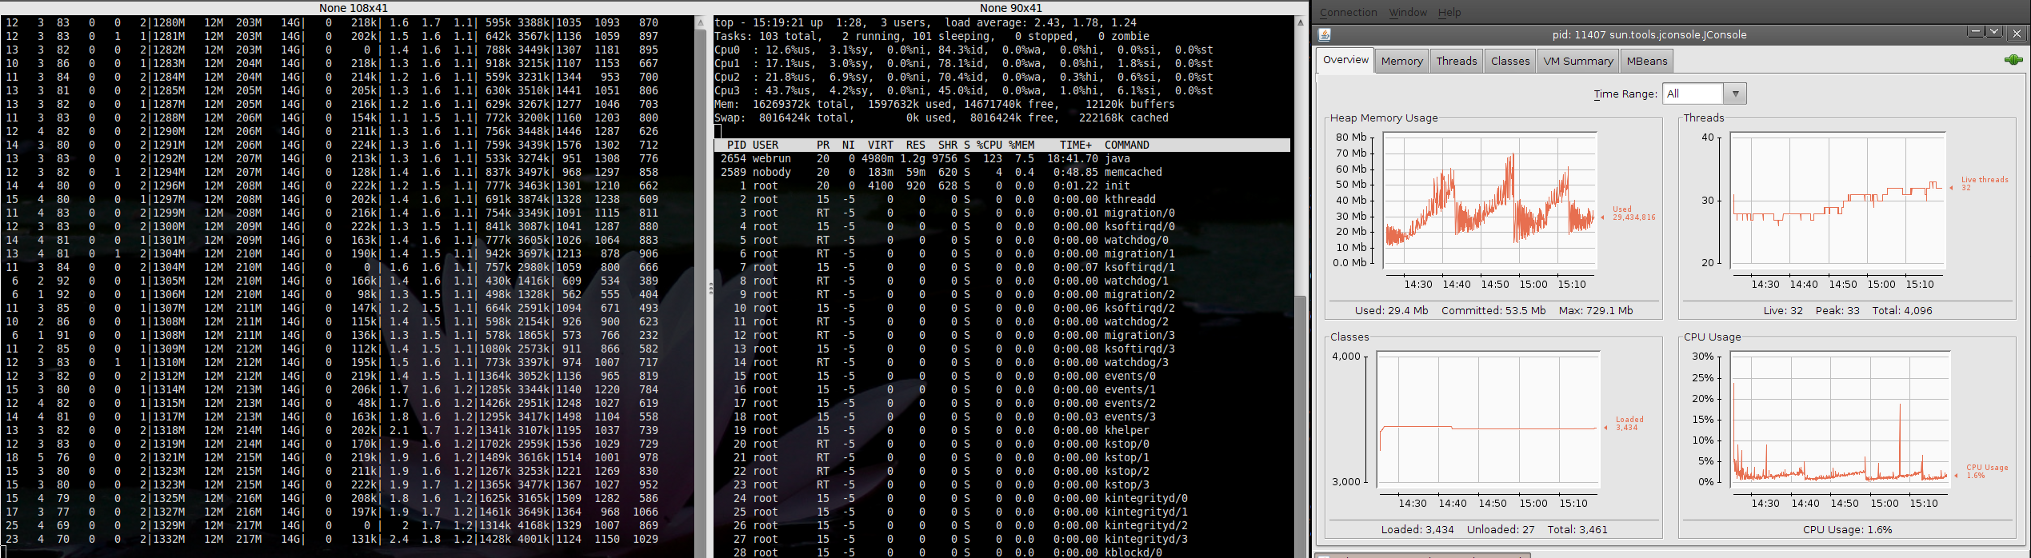
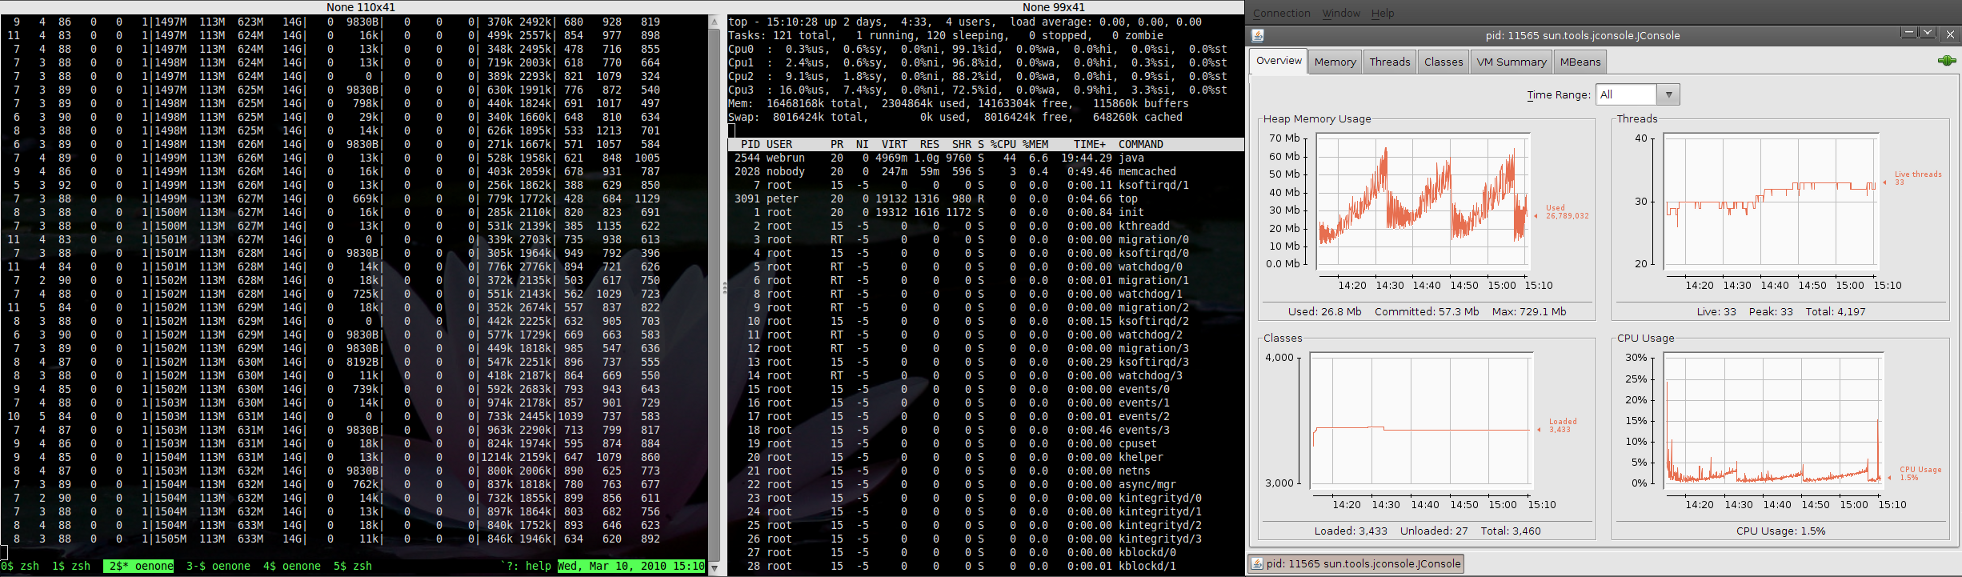
Overview:
Using java-based tools (tomcat) on 64-bit server Karmic reports almost non-existent CPU load. Screenshot ('load for 9.10') displays this. However, the same load applied to Jaunty shows a different report ('load for 9.04'). Note that stress tools applied to Karmic does result in an increase in load (as expected).
Reproducible: 100%
Workaround:
Use Jaunty.

| description: | updated |
| Changed in linux (Ubuntu): | |
| importance: | Undecided → Low |
| Changed in linux (Ubuntu): | |
| status: | Incomplete → New |
| Changed in linux (Ubuntu): | |
| status: | Incomplete → In Progress |
| Changed in linux (Ubuntu): | |
| status: | In Progress → Fix Committed |
| Changed in linux (Ubuntu Karmic): | |
| status: | New → In Progress |
| importance: | Undecided → Low |
| assignee: | nobody → Chase Douglas (chasedouglas) |
| Changed in linux (Ubuntu Karmic): | |
| status: | In Progress → Fix Committed |
| tags: |
added: verification-done removed: verification-needed |
To post a comment you must log in.
Linux ewp1 2.6.31-14-server #48-Ubuntu SMP Fri Oct 16 15:07:34 UTC 2009 x86_64 GNU/Linux