5.2 vs 5.3 CPU usage. Is it normal?

Bug #955776 reported by Anton Khalikov
6
This bug affects 1 person
Affects Status Importance Assigned to Milestone
MariaDB
Incomplete
Undecided
Axel Schwenke

Bug Description

Hello there

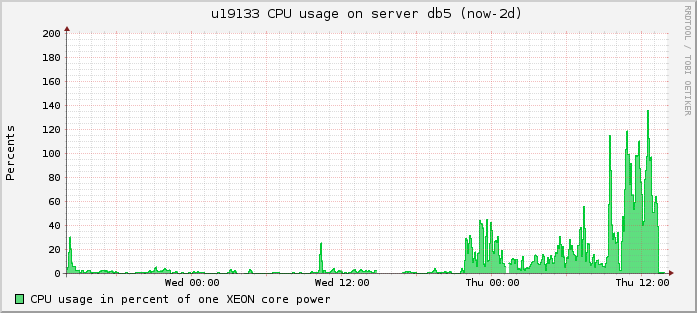
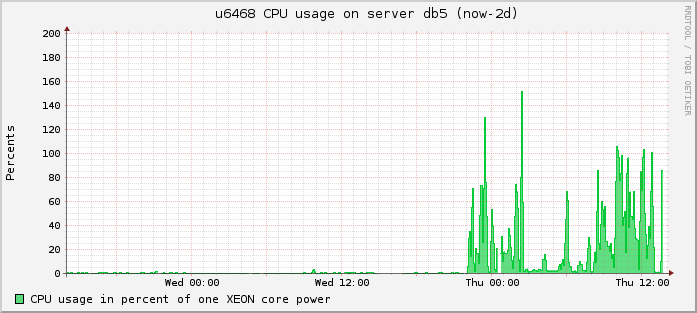
Yesterday we tried to migrate from MariaDB 5.2 to 5.3 on one of our servers. We have noticed very huge growth of CPU usage by mysqld processes. The following are 2 pictures showing what happened. Upgrade has been done at about 22:00, used default optimizer_switch settings.

http://clip2net.com/clip/m115425/1331798690-dbprousercpu1-22kb.png
http://clip2net.com/clip/m115425/1331798721-dbprousercpu2-22kb.png

After changing optimizer_switch to index_merge=on,index_merge_union=on,index_merge_sort_union=on,index_merge_intersection=on,index_merge_sort_intersection=off,index_condition_pushdown=off,derived_merge=off,derived_with_keys=off,firstmatch=off,loosescan=off,materialization=off,in_to_exists=off,semijoin=off,partial_match_rowid_merge=off,partial_match_table_scan=off,subquery_cache=off,mrr=off,mrr_cost_based=off,mrr_sort_keys=off,outer_join_with_cache=off,semijoin_with_cache=off,join_cache_incremental=off,join_cache_hashed=off,join_cache_bka=off,optimize_join_buffer_size=off,table_elimination=off (similar to 5.2 values) in some cases CPU usage decreases but not always.

Revision history for this message
Anton Khalikov (anton-khalikov) wrote :
Revision history for this message
Elena Stepanova (elenst) wrote :

Hi Anton,

Did you observe MariaDB performance drop or increase along with the CPU usage growth?
If server performance has improved respectively, it might be quite normal -- e.g. it could have happened if you have many connections running at once, and changes in 5.3 reduced the contention between parallel threads.

If it is not the case, could you please provide more information on what is happening on your MariaDB server: how high the load is, in terms of connections, requests etc.; what kind of load it is -- is it read-only mostly, or is there a lot of modification; how much data your database contains; which engines you use; hardware configuration and MariaDB cnf file; and so on. Even better, if you could identify exact queries or sequences of events that cause the increased CPU load. Please also check the slow query log to see if it contains more queries with 5.3 than it used to with 5.2. Any specifics on the problem you are experiencing would be greatly appreciated.

Thank you.

Changed in maria:
status: New → Incomplete
Revision history for this message
Anton Khalikov (anton-khalikov) wrote :

Hi Elena

The server we tried this upgrade at, is not used in a 'normal' way. Instead of single mysqld, we run several hundred of mysqld processes on it to provide 'separate mysql server' feature to our customers. So I can't say if performance improved or not. What we noticed is that the total Load Average on this server increased very high and the whole service went down few times. Disk IO was not the case but we saw 100% CPU usage frequently while it never happened before upgrade. Then I tried different optimizer_switch combinations until we decided to downgrade back to 5.2.

For the most of these mysqld instances we use the same configuration with innodb, pbxt, blackhole, archive and federated engines disabled (so only MyISAM is used in fact) and key-buffer-size/aria_pagecache_buffer_size set to 8m.

Taking some random mysqld instances into account I can say that slow-query-log was normally empty before upgrade but started to grow up after. But I am not sure if this is because of MariaDB itself or because of high Load Average and system slow down it caused. At the moment we run on 5.2 with path for bug 909635 applied.

The attached picture shows what happened on the server.

Revision history for this message
Anton Khalikov (anton-khalikov) wrote :

And just to compare, the same server's LA picture 2 days ago. Nothing changed, same amount of customer's processes, about the same load etc.

Revision history for this message
Elena Stepanova (elenst) wrote :

Anton,

Did you observe unusually high memory usage at the same time when CPU spiked?

Revision history for this message
Anton Khalikov (anton-khalikov) wrote :

Elena, this is what we had yesterday with MariaDB 5.3 (atop stats):

ATOP - db5 2012/03/15 12:15:05 600 seconds elapsed
PRC | sys 14m21s | user 64m24s | #proc 3488 | #zombie 0 | #exit 49112 |
CPU | sys 139% | user 650% | irq 12% | idle 0% | wait 0% |
cpu | sys 14% | user 86% | irq 0% | idle 0% | cpu002 w 0% |
cpu | sys 17% | user 83% | irq 0% | idle 0% | cpu001 w 0% |
cpu | sys 20% | user 80% | irq 0% | idle 0% | cpu004 w 0% |
cpu | sys 18% | user 82% | irq 0% | idle 0% | cpu005 w 0% |
cpu | sys 20% | user 80% | irq 0% | idle 0% | cpu006 w 0% |
cpu | sys 17% | user 82% | irq 0% | idle 0% | cpu007 w 0% |
cpu | sys 13% | user 87% | irq 0% | idle 0% | cpu003 w 0% |
cpu | sys 19% | user 69% | irq 11% | idle 0% | cpu000 w 0% |
CPL | avg1 24.64 | avg5 26.89 | avg15 24.74 | csw 21167815 | intr 13843e3 |
MEM | tot 39.4G | free 17.9G | cache 9.9G | buff 177.5M | slab 561.8M |
SWP | tot 1.9G | free 27.2M | | vmcom 42.3G | vmlim 21.5G |
PAG | scan 0 | stall 0 | | swin 2787 | swout 0 |
DSK | cciss/c0d0 | busy 34% | read 25152 | write 62378 | avio 2 ms |

And this is the total activity of mysqld processes at the same moment:

NPROCS SYSCPU USRCPU VSIZE RSIZE RDDSK WRDSK RNET SNET MEM CMD 1/9
   539 11m33s 63m40s 98.5G 11.5G 785e3 828e3 0 0 29% mysqld

Now, the following is the same stats for today, same time, MariaDB 5.2

ATOP - db5 2012/03/16 12:20:41 10 seconds elapsed
PRC | sys 6.81s | user 22.06s | #proc 3472 | #zombie 0 | #exit 668 |
CPU | sys 72% | user 223% | irq 9% | idle 460% | wait 37% |
cpu | sys 16% | user 52% | irq 0% | idle 29% | cpu001 w 3% |
cpu | sys 13% | user 49% | irq 0% | idle 35% | cpu002 w 3% |
cpu | sys 11% | user 49% | irq 0% | idle 39% | cpu003 w 0% |
cpu | sys 16% | user 26% | irq 8% | idle 49% | cpu000 w 0% |
cpu | sys 5% | user 22% | irq 0% | idle 64% | cpu004 w 9% |
cpu | sys 7% | user 15% | irq 0% | idle 69% | cpu005 w 8% |
cpu | sys 2% | user 4% | irq 0% | idle 85% | cpu006 w 9% |
cpu | sys 1% | user 4% | irq 0% | idle 91% | cpu007 w 4% |
CPL | avg1 1.84 | avg5 2.06 | avg15 2.20 | csw 386363 | intr 168596 |
MEM | tot 39.4G | free 232.0M | cache 26.6G | buff 478.1M | slab 757.1M |
SWP | tot 1.9G | free 1.3G | | vmcom 41.2G | vmlim 21.5G |
DSK | cciss/c0d0 | busy 26% | read 22 | write 1129 | avio 2 ms |

NPROCS SYSCPU USRCPU VSIZE RSIZE RDDSK WRDSK RNET SNET MEM CMD 1/10
   540 7m47s 27m13s 94.8G 13.4G 112e3 810e3 0 0 34% mysqld

So, memory usage is about the same.

Revision history for this message
Anton Khalikov (anton-khalikov) wrote :

P.S. I meant memory usage of mysqld is about the same. But you can notice a huge difference in cache size. This is because we had one mysqld process that was growing up to few gigabytes and then got killed by oom killer which happened a few times until we restricted it.

Revision history for this message
Elena Stepanova (elenst) wrote :

Hi Anton,

We have at least one confirmed problem which makes a class of queries cause OOM and burn quite a few CPU cycles on the way: https://bugs.launchpad.net/maria/+bug/954262 . As you have several hundred mysqld processes running at once, chances are that at any moment one of them attempts to execute the "evil" query. If you think this is something you might be experiencing, I suggest to wait till the fix is released, the bug is being actively worked upon now.

Meanwhile, I will re-address your request to Axel who runs performance benchmarks, in case he has any ideas or has seen similar patterns in his tests.

Changed in maria:
assignee: nobody → Axel Schwenke (ahel)
milestone: none → 5.3
Revision history for this message
Axel Schwenke (ahel) wrote :

Hi Anton,

my educated guess is that MariaDB-5.3 introduces some optimizer feature that adds a penalty for at least some queries that you (or your customers) are running.

By looking at the optimizer_switch, it seems the only change between your "good" settings and the MariaDB 5.3 defaults is engine_condition_pushdown. Default is "on", you set it to "off".

While we know of some workload where ICP leads to performance loss, it has always been in the range of few percent, never as much as your cpu graph suggests.

The only other optimizer features that you have turned on are for the index merge algorithms. Those are quite mature and as far as I know there was no changes to those between MariaDB 5.2 and 5.3.

Since you mention the slow log - do you happen to have examples of slow queries? What we would need are example queries and table structure/data where turning ICP on shows a significant performance loss.

You also mention that the new optimizer flags don't always work. So you might have queries in the slow log with 5.3 that were never slow with 5.2? Such examples would be very helpful too.

Revision history for this message
Anton Khalikov (anton-khalikov) wrote :

Hi Axel

The optimizer_switch options shown above are the options we turned on/off after we found the problem with CPU usage. These are not the options we used to run with from the beginning. At first we used default set of options (no tuning via my.cnf at all). Then I tried to find a way to reduce CPU usage and the shown options are what I came to. But after reading this bug tracker I found that some switches may affect not only performance, but may produce wrong result sets as well. That's why we decided to downgrade back to 5.2.

I will try to find some examples of difference in slow queries and if succeed I will post examples here.

Revision history for this message
Axel Schwenke (ahel) wrote :

Hi Anton,

> The optimizer_switch options shown above are the options we turned on/off
> after we found the problem with CPU usage. These are not the options we
> used to run with from the beginning.

Yes, I'm aware of that. And as I said, those options differ from the default in just one point: engine_condition_pushdown

> I will try to find some examples of difference in slow queries and if succeed
> I will post examples here.

Excellent. Please don't forget to also show us the structure of the underlying tables (SHOW CREATE TABLE ...). If you have any data that you want to keep private, then use our write-only FTP server: http://kb.askmonty.org/en/ftp

Revision history for this message
Anton Khalikov (anton-khalikov) wrote :

Hi Axel,

After examining our slow query logs I found that normally only about 10-15 customers have something in a daily slow log. During the day we tried 5.3, amount of customers with something in a slow log grew from 10-15 to over 100. I subtracted from the list those who has slow logs daily and finally I've got 103 log files for those whom slow logs were created with 5.3 and never with 5.2.

Then, I've got top 50 most frequent queries using mysqldumpslow and this list is uploaded to your ftp server as ticket-955776-top50-slows.log. Please take a look at it and let me know which queries are interesting for you and for which of them you want to see CREATE TABLE statements and sample data.

To post a comment you must log in.
This report contains Public information  
Everyone can see this information.

Other bug subscribers

Remote bug watches

Bug watches keep track of this bug in other bug trackers.