InfluxDB dashboard doesn't filter per server all graphs of system metrics

Bug #1554986 reported by Swann Croiset
6
This bug affects 1 person
Affects Status Importance Assigned to Milestone
StackLight
Fix Committed
Low
Swann Croiset

Bug Description

cf screenshot

Revision history for this message
Swann Croiset (swann-w) wrote :
Revision history for this message
OpenStack Infra (hudson-openstack) wrote : Fix proposed to fuel-plugin-influxdb-grafana (master)

Fix proposed to branch: master
Review: https://review.openstack.org/290350

Changed in lma-toolchain:
assignee: LMA-Toolchain Fuel Plugins (mos-lma-toolchain) → Swann Croiset (swann-w)
status: Confirmed → In Progress
Revision history for this message
OpenStack Infra (hudson-openstack) wrote : Fix merged to fuel-plugin-influxdb-grafana (master)

Reviewed: https://review.openstack.org/290350
Committed: https://git.openstack.org/cgit/openstack/fuel-plugin-influxdb-grafana/commit/?id=33374cba873254dba40aacd4b2a940f704ae654b
Submitter: Jenkins
Branch: master

commit 33374cba873254dba40aacd4b2a940f704ae654b
Author: Swann Croiset <email address hidden>
Date: Wed Mar 9 10:32:14 2016 +0100

    Filter the InfluxDB system metrics by $server

    Change-Id: If70fe1c594332b25ac631fd743d353311dab53d8
    Fixes-bug: #1554986

Changed in lma-toolchain:
status: In Progress → Fix Committed
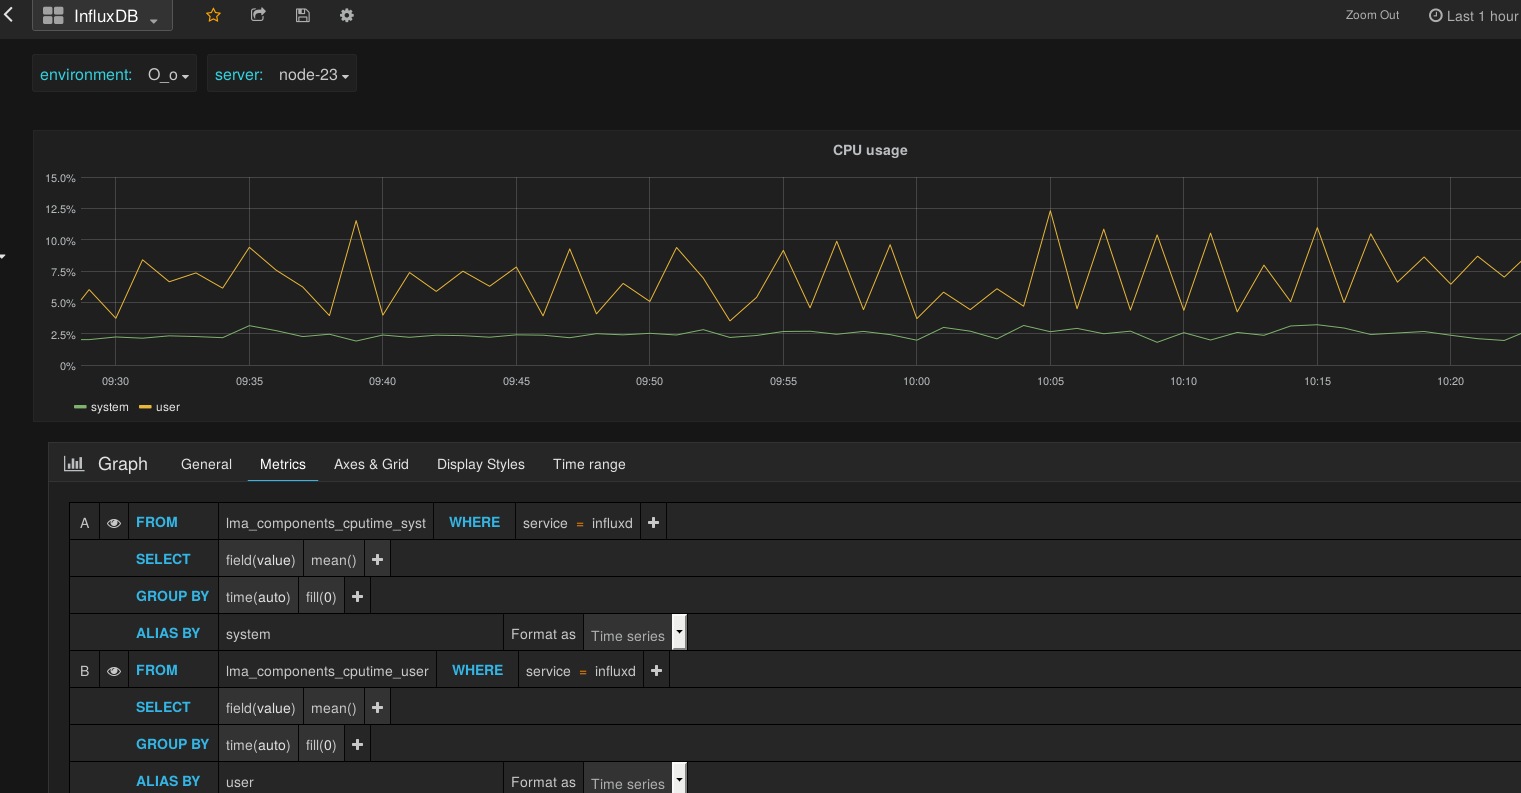
To post a comment you must log in.
This report contains Public information  
Everyone can see this information.

Other bug subscribers

Remote bug watches

Bug watches keep track of this bug in other bug trackers.