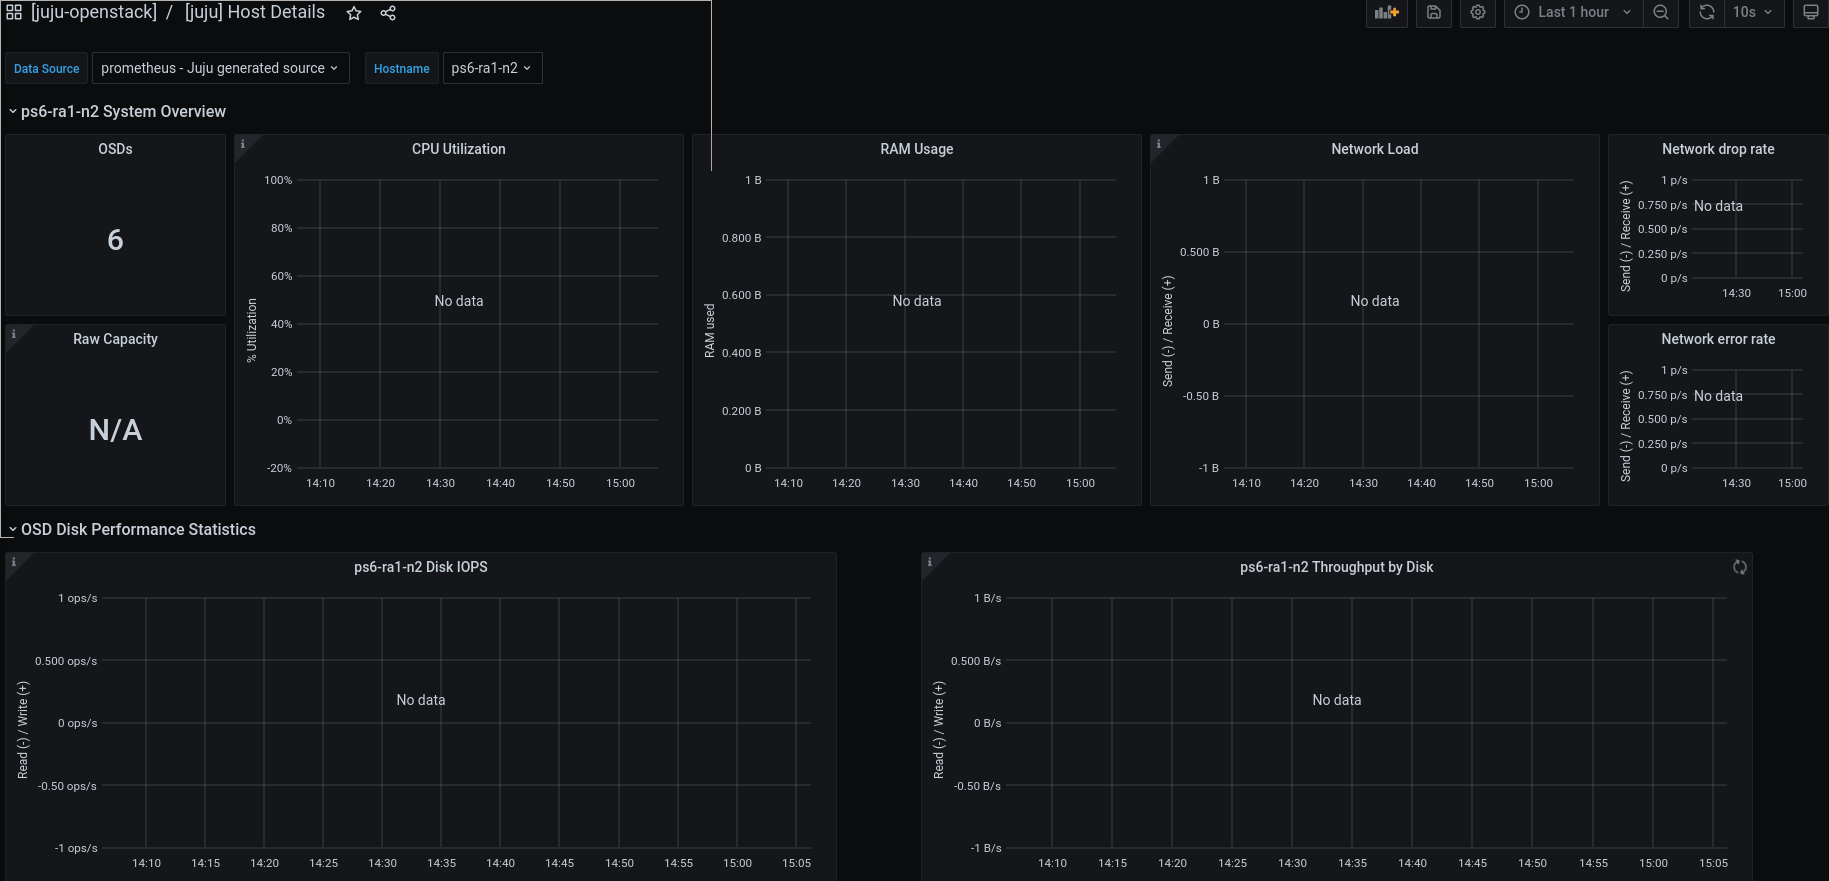
"[juju] Host Details" dashboard doesn't select any metrcis and shows no data
| Affects | Status | Importance | Assigned to | Milestone | |
|---|---|---|---|---|---|
| Grafana Charm |
Won't Fix
|
Undecided
|
Unassigned | ||
Bug Description
Hi,
It is observed on multiple clouds that the default "[juju] Host Details" dashboard doesn't show any data.
I see that for the "Hostname" dropdown variables queried with "label_
Then the dashboard tries to put filer for example the "cpu_usage_user" metric by label "host" using the "hostname" value. But the label "host" of the "cpu_usage_user" metric contains value of "<juju_
The behavior is observed for grafana snap of version "7.5.17", using charms tracking "latest/stable" of revisions 66 and 51.
Best,
Alex.

| tags: | added: bseng-2157 |
| Changed in charm-grafana: | |
| status: | New → Won't Fix |
This bug prevents us from seeing host metrics in PS6.