[COS] Ceph dashboard metrics aggregation time does not match default prometheus scrape interval
| Affects | Status | Importance | Assigned to | Milestone | |
|---|---|---|---|---|---|
| Ceph Dashboard Charm |
Triaged
|
Medium
|
Unassigned | ||
Bug Description
*Description*
COS Ceph dashboards are using prometheus queries with aggregate functions (irate) over the last 1m. Which is exactly the default Prometheus scraping interval. An irate function needs at least a vector of 2 datapoints to compute a result.
*More information*
The promQL queries used in Ceph Grafana dashboards are aggregating data over [1m].
Example:
```
"expr": "avg(irate(
```
Such query fails because, by default, Prometheus scraping interval is configured to scrape metrics every 1m.
Therefore, the irate function is unable to compute a rate of a vector with 1 datapoint only (needs at least 2)
The query irate(ceph_
Ideally, we should have metrics aggregate over an amount of time at least 2 times lower than the scraping interval (to have at least 2 datapoints to compute)
Workaround:
- Change the scraping interval to something lower than 30s using the https:/
- Manually adjust Grafana dashboards to increase the aggregation time of each promQL in each panel
Proposal:
- Change the default aggregation time from 1m to 30s in Grafana dashboards.
ceph-dashboard: quincy/stable
cos-proxy: latest/stable (rev 58)
prometheus: 2.48.0
juju: 3.1.7-genericli

| tags: | added: cos |
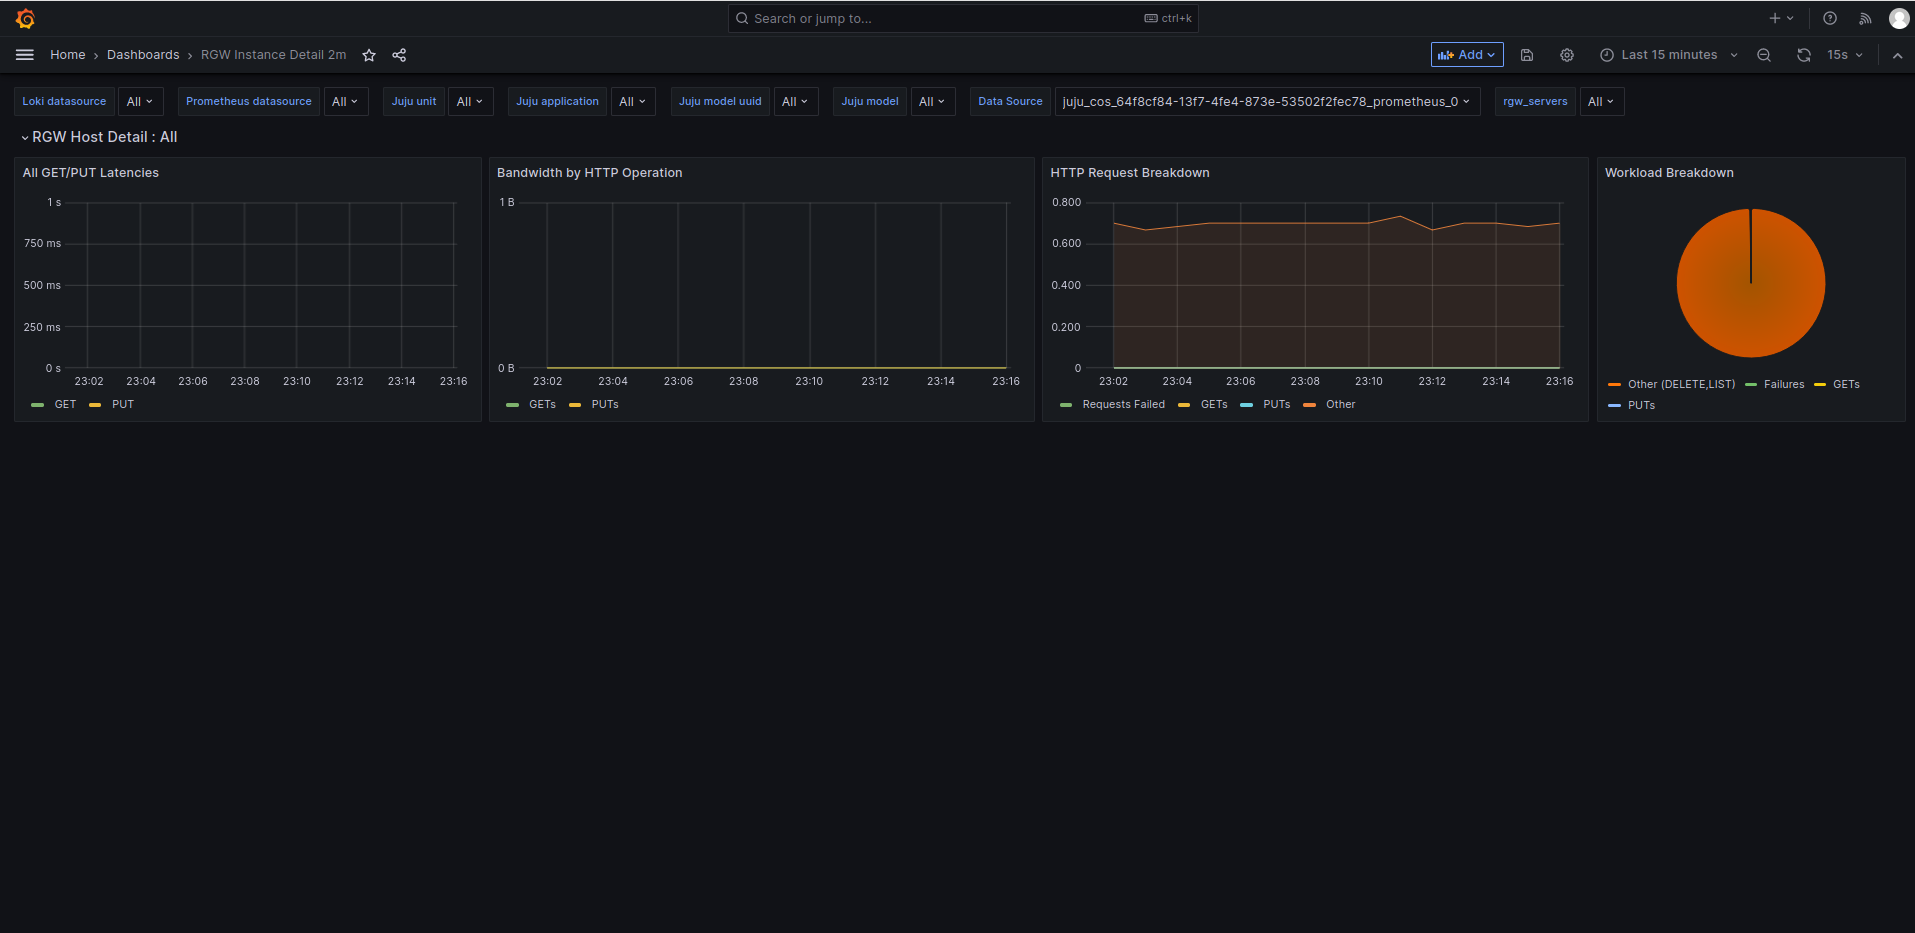
Adding screenshot rgw dashboard with 2m aggregation time