found duplicate series for the match group {ceph_daemon=\"osd.0\"}

Bug #1976528 reported by Hernan Garcia
12
This bug affects 2 people
Affects Status Importance Assigned to Milestone
Grafana Charm
New
Undecided
Unassigned
prometheus-grok-exporter-charm
Won't Fix
Undecided
Unassigned

Bug Description

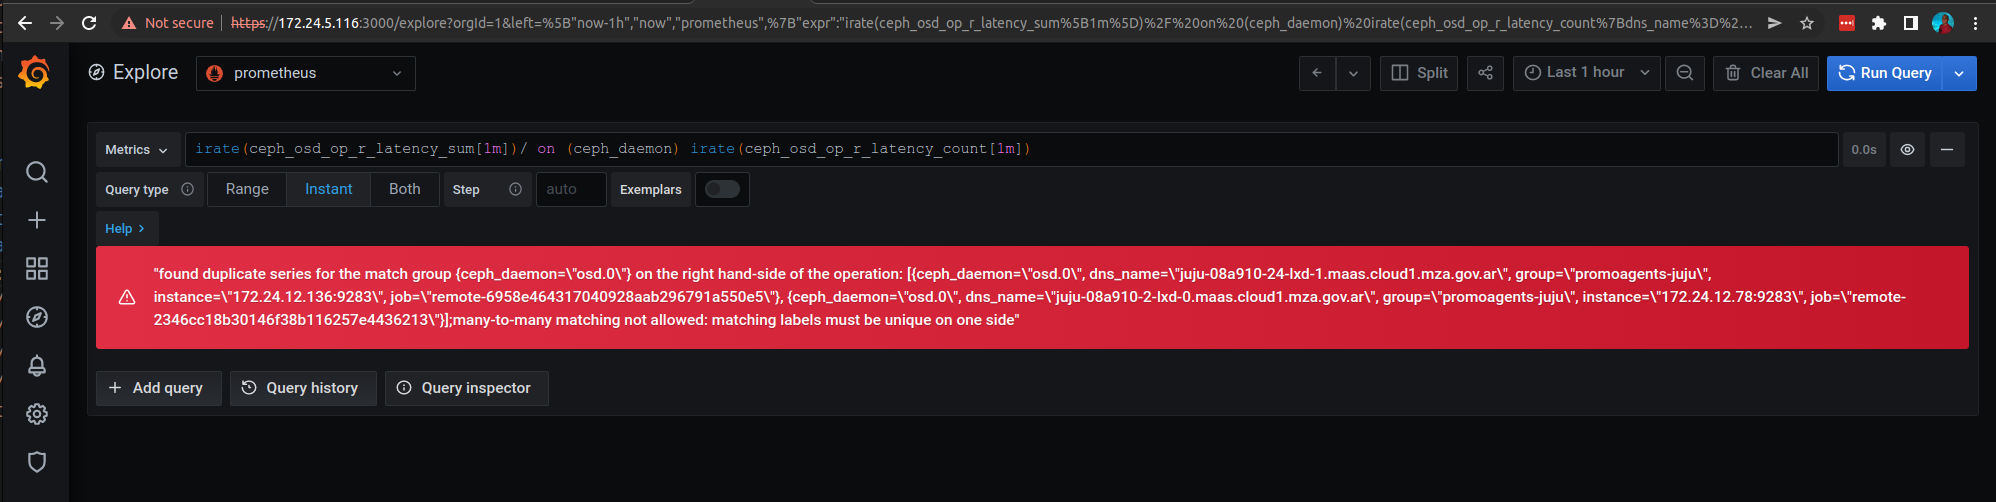
In a two(2) Datacenter customer environment we have deployed two(2) independent Ceph clusters, one on each Datacenter, we are trying to use Grafana to show the Ceph metrics

In the "[juju-openstack] / [juju] OSD device details" dashboard we can see the following error

---
"found duplicate series for the match group {ceph_daemon=\"osd.0\"} on the right hand-side of the operation: [{ceph_daemon=\"osd.0\", dns_name=\"juju-08a910-24-lxd-1.domain\", group=\"promoagents-juju\", instance=\"172.24.12.136:9283\", job=\"remote-6958e464317040928aab296791a550e5\"}, {ceph_daemon=\"osd.0\", dns_name=\"juju-08a910-2-lxd-0..domain\", group=\"promoagents-juju\", instance=\"172.24.12.78:9283\", job=\"remote-2346cc18b30146f38b116257e4436213\"}];many-to-many matching not allowed: matching labels must be unique on one side"
---

Labels are not being unique because OSD disk names are repeated in both clusters, in this case osd.0

A workaround for this could be to name OSD devices differently in both clusters, let's say osd.{0..n} in one cluster and osd{n+1..m} in the other cluster. But it will be good to fix this by making labels unique in some way

These are the relations added
---
# ceph-osd
ceph-osd-atm-zone1:juju-info prometheus-grok-exporter:juju-info juju-info subordinate
ceph-osd-dic-zone1:juju-info prometheus-grok-exporter:juju-info juju-info subordinate

# prometheus
prometheus-libvirt-exporter:dashboards grafana:dashboards grafana-dashboard regular
prometheus-openstack-exporter:dashboards grafana:dashboards grafana-dashboard regular

# grafana
ceph-dashboard-atm-zone1:grafana-dashboard grafana:dashboards grafana-dashboard regular
ceph-dashboard-dic-zone1:grafana-dashboard grafana:dashboards grafana-dashboard regular
prometheus-libvirt-exporter:dashboards grafana:dashboards grafana-dashboard regular
prometheus-openstack-exporter:dashboards grafana:dashboards grafana-dashboard regular
---

Tags: bseng-149
Revision history for this message
Hernan Garcia (hernandanielg) wrote :
affects: charm-prometheus-grok-exporter → charm-ceph-osd
affects: charm-ceph-osd → charm-prometheus-grok-exporter
description: updated
Revision history for this message
Hernan Garcia (hernandanielg) wrote :
Revision history for this message
Chris MacNaughton (chris.macnaughton) wrote :

charm-ceph-osd doesn't have anything to do with sending metrics (or configuring them to send) to prometheus.

Changed in charm-ceph-osd:
status: New → Invalid
no longer affects: charm-ceph-osd
Andrea Ieri (aieri)
tags: added: bseng-149
Revision history for this message
Eric Chen (eric-chen) wrote :

This charm is no longer being actively maintained. Please consider using the new Canonical Observability Stack instead. (https://charmhub.io/topics/canonical-observability-stack)

Changed in charm-prometheus-grok-exporter:
status: New → Won't Fix
To post a comment you must log in.
This report contains Public information  
Everyone can see this information.

Other bug subscribers

Remote bug watches

Bug watches keep track of this bug in other bug trackers.