/proc/diskstats shows weird values

Bug #1790181 reported by Jens Peter
16
This bug affects 3 people
Affects Status Importance Assigned to Milestone
Debian
Fix Released
Unknown
linux (Ubuntu)
Confirmed
Medium
Unassigned

Bug Description

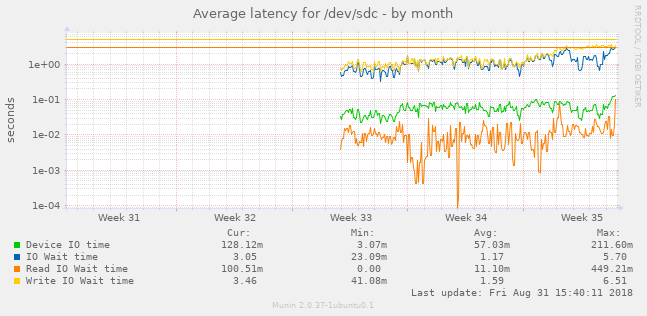
For one block device on one of my servers munin shows abnormally high latency.

When querying /proc/diskstats manually, the device in question shows:
   8 32 sdc 973668 361965 64248290 10224376 755130 518162 22349256 1347171224 63 54302956 1357481880

Sanity check:
If I divide the 7th value by the 4th value I get a avg read latency of about 10.5 ms. That is somewhat in line with the Avg. Read IO Wait Time of 11.35 ms that munin reports.

The problem:
If I divide the 11th value by the 8th value I get an avg write latency of 1789 ms. That is also close to the Avg. Write IO Wait Time of 1.60 s reported by munin. Now this is an SD card and it is slow, but not THAT slow..

To confirm unexpected values, I measured some activity:

    $ dd if=/dev/urandom of=testfile bs=1M count=100; time sync;
    cat /proc/diskstats
    100+0 records in
    100+0 records out
    104857600 bytes (105 MB, 100 MiB) copied, 18,7652 s, 5,6 MB/s

    real 0m8,132s
    user 0m0,000s
    sys 0m0,007s

The reported time spent writing went from 1353896856 before the test to 1356759112 after the test.
The difference is 2862256 ms or about 2800 seconds that supposedly passed in just over 26 real time seconds.
I repeated the test with count=1 and got 5780 ms IO write time reported in .7 s realtime.

#1297522 describes a similar error but I have no idea if the cause is related.

System information:
Description: Ubuntu 18.04.1 LTS
Release: 18.04

Linux 4.15.0-30-generic #32-Ubuntu SMP Thu Jul 26 17:42:43 UTC 2018 x86_64 x86_64 GNU/Linux

/dev/sdc is a Dell dual SD card module in RAID 1 mode with two Lexar 8GB U3 cards.
The system is a Dell R530.
---
ProblemType: Bug
AlsaDevices:
 total 0
 crw-rw---- 1 root audio 116, 1 Aug 11 22:30 seq
 crw-rw---- 1 root audio 116, 33 Aug 11 22:30 timer
AplayDevices: Error: [Errno 2] No such file or directory: 'aplay': 'aplay'
ApportVersion: 2.20.9-0ubuntu7.2
Architecture: amd64
ArecordDevices: Error: [Errno 2] No such file or directory: 'arecord': 'arecord'
AudioDevicesInUse: Error: command ['fuser', '-v', '/dev/snd/seq', '/dev/snd/timer'] failed with exit code 1:
DistroRelease: Ubuntu 18.04
HibernationDevice: RESUME=UUID=719079af-279c-46cd-9438-01086a2cb16e
InstallationDate: Installed on 2016-03-29 (885 days ago)
InstallationMedia: Ubuntu-Server 14.04.3 LTS "Trusty Tahr" - Beta amd64 (20150805)
MachineType: Dell Inc. PowerEdge R530
Package: linux (not installed)
PciMultimedia:

ProcFB: 0 mgadrmfb
ProcKernelCmdLine: BOOT_IMAGE=/boot/vmlinuz-4.15.0-30-generic root=UUID=9be44daa-0a66-486f-9fac-ff0814849ed3 ro crashkernel=384M-:128M crashkernel=384M-:128M crashkernel=384M-:128M crashkernel=384M-:128M crashkernel=384M-2G:128M,2G-:256M crashkernel=384M-2G:128M,2G-:256M crashkernel=384M-2G:128M,2G-:256M crashkernel=384M-2G:128M,2G-:256M crashkernel=384M-2G:128M,2G-:256M
ProcVersionSignature: Ubuntu 4.15.0-30.32-generic 4.15.18
RelatedPackageVersions:
 linux-restricted-modules-4.15.0-30-generic N/A
 linux-backports-modules-4.15.0-30-generic N/A
 linux-firmware 1.173.1
RfKill: Error: [Errno 2] No such file or directory: 'rfkill': 'rfkill'
Tags: bionic
Uname: Linux 4.15.0-30-generic x86_64
UnreportableReason: This report is about a package that is not installed.
UpgradeStatus: Upgraded to bionic on 2018-08-11 (19 days ago)
UserGroups: adm cdrom dip libvirt libvirtd lpadmin plugdev sambashare sudo
_MarkForUpload: False
dmi.bios.date: 10/05/2015
dmi.bios.vendor: Dell Inc.
dmi.bios.version: 1.5.4
dmi.board.name: 0HFG24
dmi.board.vendor: Dell Inc.
dmi.board.version: A01
dmi.chassis.type: 23
dmi.chassis.vendor: Dell Inc.
dmi.modalias: dmi:bvnDellInc.:bvr1.5.4:bd10/05/2015:svnDellInc.:pnPowerEdgeR530:pvr:rvnDellInc.:rn0HFG24:rvrA01:cvnDellInc.:ct23:cvr:
dmi.product.name: PowerEdge R530
dmi.sys.vendor: Dell Inc.

Revision history for this message
Jens Peter (3s-jp) wrote :
Jens Peter (3s-jp)
affects: munin (Ubuntu) → linux (Ubuntu)
Revision history for this message
Ubuntu Kernel Bot (ubuntu-kernel-bot) wrote : Missing required logs.

This bug is missing log files that will aid in diagnosing the problem. While running an Ubuntu kernel (not a mainline or third-party kernel) please enter the following command in a terminal window:

apport-collect 1790181

and then change the status of the bug to 'Confirmed'.

If, due to the nature of the issue you have encountered, you are unable to run this command, please add a comment stating that fact and change the bug status to 'Confirmed'.

This change has been made by an automated script, maintained by the Ubuntu Kernel Team.

Changed in linux (Ubuntu):
status: New → Incomplete
tags: added: bionic
Revision history for this message
Jens Peter (3s-jp) wrote : CRDA.txt

apport information

tags: added: apport-collected
description: updated
Revision history for this message
Jens Peter (3s-jp) wrote : CurrentDmesg.txt

apport information

Revision history for this message
Jens Peter (3s-jp) wrote : IwConfig.txt

apport information

Revision history for this message
Jens Peter (3s-jp) wrote : Lspci.txt

apport information

Revision history for this message
Jens Peter (3s-jp) wrote : Lsusb.txt

apport information

Revision history for this message
Jens Peter (3s-jp) wrote : ProcCpuinfoMinimal.txt

apport information

Revision history for this message
Jens Peter (3s-jp) wrote : ProcEnviron.txt

apport information

Revision history for this message
Jens Peter (3s-jp) wrote : ProcInterrupts.txt

apport information

Revision history for this message
Jens Peter (3s-jp) wrote : ProcModules.txt

apport information

Revision history for this message
Jens Peter (3s-jp) wrote : UdevDb.txt

apport information

Revision history for this message
Jens Peter (3s-jp) wrote : WifiSyslog.txt

apport information

Changed in linux (Ubuntu):
status: Incomplete → Confirmed
Revision history for this message
Joseph Salisbury (jsalisbury) wrote :

Did this issue start happening after an update/upgrade? Was there a prior kernel version where you were not having this particular problem?

Would it be possible for you to test the latest upstream kernel? Refer to https://wiki.ubuntu.com/KernelMainlineBuilds . Please test the latest v4.19 kernel[0].

If this bug is fixed in the mainline kernel, please add the following tag 'kernel-fixed-upstream'.

If the mainline kernel does not fix this bug, please add the tag: 'kernel-bug-exists-upstream'.

Once testing of the upstream kernel is complete, please mark this bug as "Confirmed".

Thanks in advance.

[0] http://kernel.ubuntu.com/~kernel-ppa/mainline/v4.19-rc2

Changed in linux (Ubuntu):
importance: Undecided → Medium
status: Confirmed → Incomplete
Revision history for this message
Jens Peter (3s-jp) wrote :

I noticed the bug only after I installed munin recently. I don't know how long it may have existed before.

I will test the mainline kernel as soon as I can but since the machine is used in production and can't be rebooted at will so testing probably be 2 weeks out.

Thanks for your reply.

Jens Peter (3s-jp)
tags: added: kernel-bug-exists-upstream
Revision history for this message
Jens Peter (3s-jp) wrote :

Testing with http://kernel.ubuntu.com/~kernel-ppa/mainline/v4.19-rc2/ shows:

Writes on the sd card are still reported about a factor 1000 too high, e.g. 27000000ms = 27000s where I expect around 27s.
I tried on an nvme ssd with the same result, just smaller numbers and /dev/urandom was the bottleneck.

I suspect that the kernel is actually reporting µs instead of ms although that is wild speculation.

Changed in linux (Ubuntu):
status: Incomplete → Confirmed
Revision history for this message
Jens Peter (3s-jp) wrote :

On my laptop with a SATA ssd I also have higher reported times than process real time, albeit not by such a huge margin. Only a factor of 2-4 too high.

Revision history for this message
nyet (nyetwurk) wrote :

It looks like partitions are being reported correctly, just not the main device

$ cat /proc/diskstats | awk '{print $3, $7, $11, $7+$11, $13, $14}' | grep nvme
nvme0n1 22988 457568 480556 2440737408 2441207708
nvme0n1p1 22988 339624 362612 528884 978496
nvme0n1p2 0 0 0 0 0
nvme0n1p5 0 0 0 4 4

Note that the $7+$11 column for n1p1 isn't that far off of $13

Revision history for this message
nyet (nyetwurk) wrote :

drivers/md/dm-stats.c:

static void dm_stat_round(struct dm_stat *s, struct dm_stat_shared *shared,
                          struct dm_stat_percpu *p)
{
        /*
         * This is racy, but so is part_round_stats_single.
         */
        unsigned long long now, difference;
        unsigned in_flight_read, in_flight_write;

        if (likely(!(s->stat_flags & STAT_PRECISE_TIMESTAMPS)))
                now = jiffies;
        else
                now = ktime_to_ns(ktime_get());

Should that be ktime_to_us()?

Revision history for this message
nyet (nyetwurk) wrote :

https://www.redhat.com/archives/dm-devel/2015-June/msg00042.html

https://www.redhat.com/archives/dm-devel/2015-June/msg00057.html

Something is really really screwy here.

Some stats are in ns, some are in ms:

Index: linux-4.1-rc7/Documentation/device-mapper/statistics.txt
===================================================================
--- linux-4.1-rc7.orig/Documentation/device-mapper/statistics.txt 2015-06-08 16:38:59.000000000 +0200
+++ linux-4.1-rc7/Documentation/device-mapper/statistics.txt 2015-06-08 17:00:05.000000000 +0200
@@ -13,9 +13,13 @@ the range specified.
 The I/O statistics counters for each step-sized area of a region are
 in the same format as /sys/block/*/stat or /proc/diskstats (see:
 Documentation/iostats.txt). But two extra counters (12 and 13) are
-provided: total time spent reading and writing in milliseconds. All
-these counters may be accessed by sending the @stats_print message to
-the appropriate DM device via dmsetup.
+provided: total time spent reading and writing. All these counters may
+be accessed by sending the @stats_print message to the appropriate DM
+device via dmsetup.
+
+The reported times are in milliseconds and the granularity depends on
+the kernel ticks. When the option precise_timestamps is used, the
+reported times are in nanoseconds.

 Each region has a corresponding unique identifier, which we call a
 region_id, that is assigned when the region is created. The region_id

Revision history for this message
nyet (nyetwurk) wrote :

iostat is showing the same thing btw.

See also https://access.redhat.com/solutions/1462993

Revision history for this message
nyet (nyetwurk) wrote :

Here is my patch for munin diskstats:

diff -u diskstats-dist diskstats
--- diskstats-dist 2018-09-29 16:28:39.933727540 -0700
+++ diskstats 2018-11-12 09:54:56.850815309 -0800
@@ -234,6 +234,9 @@
     # a given second, the device is nearly 100% saturated.
     my $utilization = $tot_ticks / $interval;

+ # NVME drives tend to show nearly 100% util, so lets use r+w as an alternate
+ my $rw_util = ($rd_ticks + $wr_ticks) / $interval;
+
     # Average time an I/O takes on the block device
     my $servicetime_in_sec =
       $total_ios_per_sec ? $utilization / $total_ios_per_sec / 1000 : 0;
@@ -253,9 +256,11 @@
       : 0;

     my $util_print = $utilization / 10;
+ my $rw_util_print = $rw_util / 10;

     return {
         utilization => $util_print,
+ rw_util => $rw_util_print,
         servicetime => $servicetime_in_sec,
         average_wait => $average_wait_in_sec,
         average_rd_wait => $average_rd_wait_in_sec,
@@ -298,6 +303,8 @@

         print "${graph_id}_util.value "
           . $result->{$device}->{'utilization'} . "\n";
+ print "${graph_id}_rw_util.value "
+ . $result->{$device}->{'rw_util'} . "\n";
     }

     print "\nmultigraph ${plugin_name}_throughput\n";
@@ -342,6 +349,7 @@

 multigraph ${plugin_name}_utilization.$graph_id
 util.value $result->{'utilization'}
+rw_util.value $result->{'rw_util'}
 EOF

     }
@@ -784,6 +792,11 @@
 ${graph_id}_util.info Utilization of the device
 ${graph_id}_util.min 0
 ${graph_id}_util.draw LINE1
+${graph_id}_rw_util.label $cur_diskstats{$device}->{'pretty_device_name'}
+${graph_id}_rw_util.type GAUGE
+${graph_id}_rw_util.info Read/write utilization of the device
+${graph_id}_rw_util.min 0
+${graph_id}_rw_util.draw LINE1
 EOF
     }

Revision history for this message
nyet (nyetwurk) wrote :

https://forums.fedoraforum.org/showthread.php?318580-iostat-svctm-and-busy-numbers-are-wrong-for-NVME-drives

I think summing wr_ticks and rd_ticks might actually be the right solution.

Revision history for this message
nyet (nyetwurk) wrote :

After rebooting, the values are < 2^31 and utilization is reporting fine. I feel this is a 31/32 bit overflow issue.

Changed in debian:
status: Unknown → New
Brad Figg (brad-figg)
tags: added: ubuntu-certified
tags: added: cscc
Changed in debian:
status: New → Fix Released
To post a comment you must log in.
This report contains Public information  
Everyone can see this information.

Other bug subscribers

Remote bug watches

Bug watches keep track of this bug in other bug trackers.