Miss debug information in code built with lto

Bug #1379254 reported by Terry Guo
10
This bug affects 1 person
Affects Status Importance Assigned to Milestone
GNU Arm Embedded Toolchain
Fix Released
Undecided
Terry Guo

Bug Description

Build attached project and then debug the elf file, inside gdb we can see the mixed view of assembly code and c source code:

(gdb) disassemble /m main
Dump of assembler code for function main():
5 int main() {
   0x00000194 <+0>: push {r3, lr}

6 while(1) {
7 myled = 0;
8 wait(0.2);
   0x00000198 <+4>: ldr r0, [pc, #28] ; (0x1b8 <main()+36>)
   0x000001a0 <+12>: bl 0x1464 <wait>

9 myled = 0;
10 wait(0.2);
   0x000001a8 <+20>: ldr r0, [pc, #12] ; (0x1b8 <main()+36>)
   0x000001ac <+24>: bl 0x1464 <wait>
   0x000001b0 <+28>: b.n 0x196 <main()+2>
   0x000001b2 <+30>: nop
   0x000001b4 <+32>: lsls r0, r3, #6
   0x000001b6 <+34>: asrs r0, r0, #32
   0x000001b8 <+36>: ldmia r4!, {r0, r2, r3, r6, r7}
   0x000001ba <+38>: subs r6, #76 ; 0x4c

End of assembler dump.

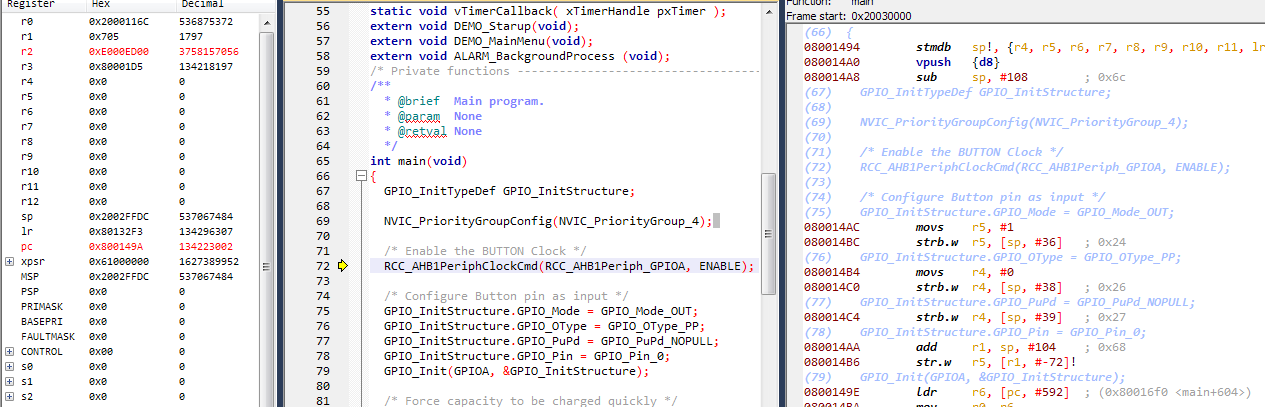
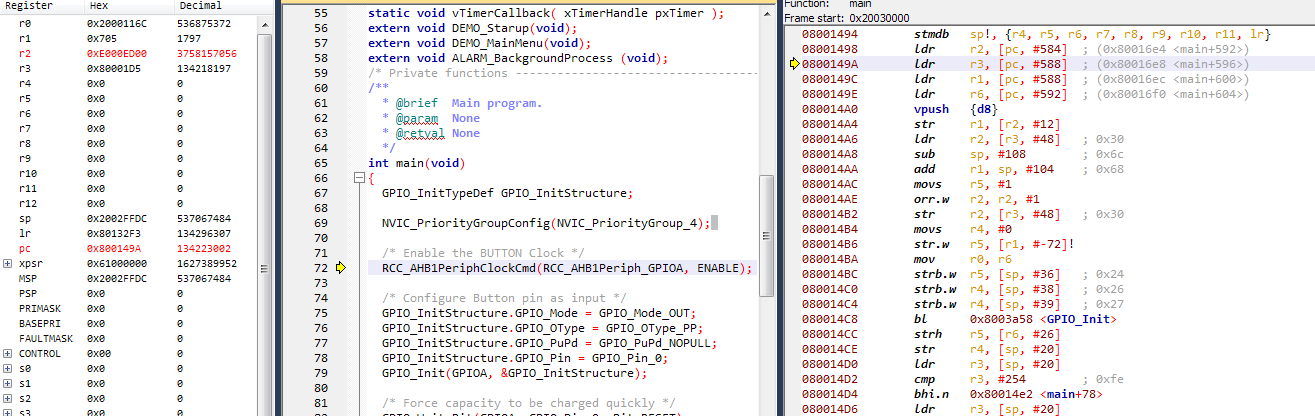
But when build the project with option -flto, we won't be able to see such mixed view. It seems some debug information are missed due to lto:

terguo01@terry-pc01:lto-debug-issue$ arm-none-eabi-gdb mbed_blinky_1768.elf
GNU gdb (GNU Tools for ARM Embedded Processors) 7.6.0.20140731-cvs
Copyright (C) 2013 Free Software Foundation, Inc.
License GPLv3+: GNU GPL version 3 or later <http://gnu.org/licenses/gpl.html>
This is free software: you are free to change and redistribute it.
There is NO WARRANTY, to the extent permitted by law. Type "show copying"
and "show warranty" for details.
This GDB was configured as "--host=x86_64-unknown-linux-gnu --target=arm-none-eabi".
For bug reporting instructions, please see:
<http://www.gnu.org/software/gdb/bugs/>...
Reading symbols from /work/terguo01/tasks/stm32f429/lto-debug-issue/mbed_blinky_1768.elf...(no debugging symbols found)...done.
(gdb) disassemble /m main
Dump of assembler code for function main:
   0x00000194 <+0>: push {r7, lr}
   0x00000196 <+2>: sub sp, #16
   0x00000198 <+4>: add r7, sp, #0
   0x0000019a <+6>: ldr r3, [pc, #84] ; (0x1f0 <main+92>)

Revision history for this message
Terry Guo (terry.guo) wrote :
Revision history for this message
emblocks (gnugcc) wrote :

Hi, any news on this issue?

Has it something to do with skipped flags during LTO?

I want to use the 4.8 toolchain for the next Emblocks release but this issue is a bit annoying.

Thanks!

Revision history for this message
Terry Guo (terry.guo) wrote :
Download full text (4.5 KiB)

It seems that LTO will discard all debug sections. Here is the section list of object built without lto:

Section Headers:
  [Nr] Name Type Addr Off Size ES Flg Lk Inf Al
  [ 0] NULL 00000000 000000 000000 00 0 0 0
  [ 1] .text PROGBITS 00000000 000034 000000 00 AX 0 0 2
  [ 2] .data PROGBITS 00000000 000034 000000 00 WA 0 0 1
  [ 3] .bss NOBITS 00000000 000034 000000 00 WA 0 0 1
  [ 4] .text.startup.mai PROGBITS 00000000 000034 000028 00 AX 0 0 4
  [ 5] .rel.text.startup REL 00000000 003a70 000018 08 26 4 4
  [ 6] .text.startup._GL PROGBITS 00000000 00005c 000024 00 AX 0 0 4
  [ 7] .rel.text.startup REL 00000000 003a88 000018 08 26 6 4
  [ 8] .init_array INIT_ARRAY 00000000 000080 000004 00 WA 0 0 4
  [ 9] .rel.init_array REL 00000000 003aa0 000008 08 26 8 4
  [10] .bss.myled NOBITS 00000000 000084 000018 00 WA 0 0 4
  [11] .debug_info PROGBITS 00000000 000084 001c7f 00 0 0 1
  [12] .rel.debug_info REL 00000000 003aa8 000da8 08 26 11 4
  [13] .debug_abbrev PROGBITS 00000000 001d03 0003c7 00 0 0 1
  [14] .debug_aranges PROGBITS 00000000 0020ca 000028 00 0 0 1
  [15] .rel.debug_arange REL 00000000 004850 000018 08 26 14 4
  [16] .debug_ranges PROGBITS 00000000 0020f2 000060 00 0 0 1
  [17] .rel.debug_ranges REL 00000000 004868 000080 08 26 16 4
  [18] .debug_line PROGBITS 00000000 002152 0003cf 00 0 0 1
  [19] .rel.debug_line REL 00000000 0048e8 000010 08 26 18 4
  [20] .debug_str PROGBITS 00000000 002521 000cba 01 MS 0 0 1
  [21] .comment PROGBITS 00000000 0031db 000074 01 MS 0 0 1
  [22] .debug_frame PROGBITS 00000000 003250 000044 00 0 0 4
  [23] .rel.debug_frame REL 00000000 0048f8 000020 08 26 22 4
  [24] .ARM.attributes ARM_ATTRIBUTES 00000000 003294 000033 00 0 0 1
  [25] .shstrtab STRTAB 00000000 0032c7 00010d 00 0 0 1
  [26] .symtab SYMTAB 00000000 003834 0001f0 10 27 26 4
  [27] .strtab STRTAB 00000000 003a24 00004a 00 0 0 1

We can find the debug sections like .debug_info/.debug_line. While if we build same file with lto, there is no such debug section:

Section Headers:
  [Nr] Name Type Addr Off Size ES Flg Lk Inf Al
  [ 0] NULL 00000000 000000 000000 00 0 0 0
  [ 1] .text PROGBITS 00000000 000034 000000 00 AX 0 0 2
  [ 2] .data PROGBITS 00000000 000034 000000 00 WA 0 0 1
  [ 3] .bss NOBITS 00000000 000034 000000 00 WA 0 0 1
  [ 4] .gnu.lto_.profile PROGBITS 00000000 000034 000013 00 E 0 0 1
  [ 5] .gnu.lto_.jmpfunc PROGBITS 00000000 000047 0000ca 00 E 0 0 1
  [ 6] .gnu...

Read more...

Revision history for this message
Terry Guo (terry.guo) wrote :

I am wrong about comment #3. In fact the debug sections are kept in object files. In the final link stage, with option "-flto -g", we will see them in final image file. But the problem still exists, no mix view.

Revision history for this message
emblocks (gnugcc) wrote :

Strange!

I was thinking the same direction that the debug info was omitted during LTO phase.

Revision history for this message
Terry Guo (terry.guo) wrote :

For mixed view issue, I am suspecting that the information in final .debug_line section don't reflect the final generated code. I will take a deeper look tomorrow.

Revision history for this message
emblocks (gnugcc) wrote :

Thanks.

Revision history for this message
Terry Guo (terry.guo) wrote :

Must be caused by gdb bug at https://sourceware.org/bugzilla/show_bug.cgi?id=17559. The fix will be in upcoming 4.9 major release.

Changed in gcc-arm-embedded:
status: New → Confirmed
status: Confirmed → Fix Committed
milestone: none → 4.9-2014-q4-major
Revision history for this message
emblocks (gnugcc) wrote :

Thanks Terry, I will try the patch today.

Revision history for this message
emblocks (gnugcc) wrote :

Ok, I applied the patch and there is now source info in the disassembly. However, totally meaningless and at wrong locations.

This wont solve the problem that we have, I'm afraid.

Revision history for this message
Terry Guo (terry.guo) wrote :

Would you please paste your screen?

Revision history for this message
emblocks (gnugcc) wrote :

This is a screen shot with mixed mode view.

Despite the fact that the address is in range of the function, it can show the assembly

Revision history for this message
emblocks (gnugcc) wrote :

Second screen shot without mixed mode view

Revision history for this message
Terry Guo (terry.guo) wrote :

Which gdb are you applying the fix to? Since you know how to build arm-none-eabi-gdb, would you please try with latest gdb mainline directly? If everything works fine, we could just back port some fixes.

By the way I applied the patch to gdb 7.8.1 which is the latest release and looks like everything works fine.

Revision history for this message
emblocks (gnugcc) wrote :

GDB 7.7. I will look into this today.

With 7.8.1 don't you notice that the instructions of the actual PC aren't in the GDB response? It looks like it works fine because you get a more or less meaningful answer from GDB but the current PC instruction is missing.

Terry Guo (terry.guo)
Changed in gcc-arm-embedded:
milestone: 4.9-2014-q4-major → 4.9-2015-q1-update
status: Fix Committed → In Progress
Terry Guo (terry.guo)
Changed in gcc-arm-embedded:
status: In Progress → Fix Committed
Terry Guo (terry.guo)
Changed in gcc-arm-embedded:
status: Fix Committed → Fix Released
To post a comment you must log in.
This report contains Public information  
Everyone can see this information.

Other bug subscribers

Remote bug watches

Bug watches keep track of this bug in other bug trackers.