
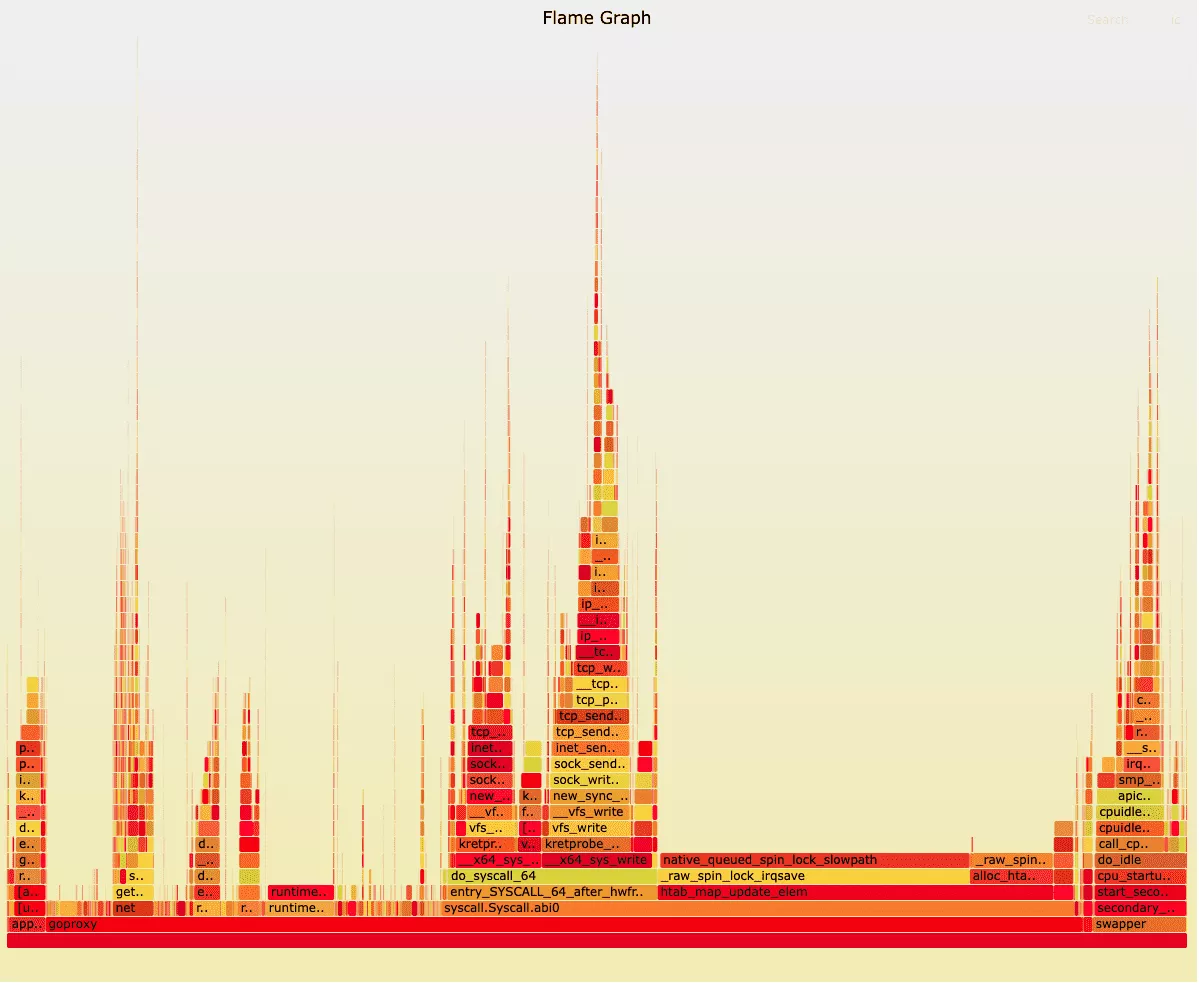
AppArmor causing the kernel to spend 30% of its time in a spin-lock
| Affects | Status | Importance | Assigned to | Milestone | |
|---|---|---|---|---|---|
| AppArmor |
New
|
Undecided
|
Unassigned | ||
Bug Description
Hi,
We run some proxies, written in Go. pprof returned that all calls were spent in network I/O write.
Looking into the issue with
echo "function_graph" > /sys/kernel/
echo 1 > /sys/kernel/
cat /sys/kernel/
echo "00000000,
The kernel function do_syscall_64 is used to perform the IO calls. The data indicated that most calls returned within a perfectly reasonable time but that some calls inexplicably took 10s to 100s of milliseconds, matching what we'd already observed with the output of perf.
Further analysis showed an interesting pattern that occurred in "slow" calls:
kprobe_
93) 0.140 us | get_kprobe();
93) | pre_handler_
93) 0.150 us | _raw_spin_
93) 0.150 us | _raw_spin_
93) 0.150 us | arch_prepare_
93) | _raw_spin_
93) # 1459.327 us | native_
93) # 1460.008 us | }
93) | _raw_spin_
and
79) | trampoline_
79) 0.140 us | kprobe_
79) | kretprobe_
79) 0.150 us | _raw_spin_
79) 0.411 us | }
79) 0.140 us | percpu_
79) 0.140 us | percpu_
79) 0.140 us | bpf_get_
79) | __htab_
79) 0.150 us | lookup_
79) 0.652 us | }
79) | htab_map_
79) | _raw_spin_
79) # 1433.058 us | native_
79) # 1434.020 us | }
The CPU core was busy acquiring a spinlock for about 1/3 of the available time. The proportion of 'wasted' time grew as the traffic increased and the problem worsened, and threads become more likely to vie for the shared resource.
Once the server reached 2 Gbps of traffic, the machine was unable to handle traffic any more.
Removing AppArmor and rebooting the server fixed the issue.

What kernel version?
How many cpus on the system?
A rough guess of tasks/threads would be nice if its even possible to get an estimate.